
Table of Contents
An ETF prospectus is long, dry and written by lawyers. Most people never open one.
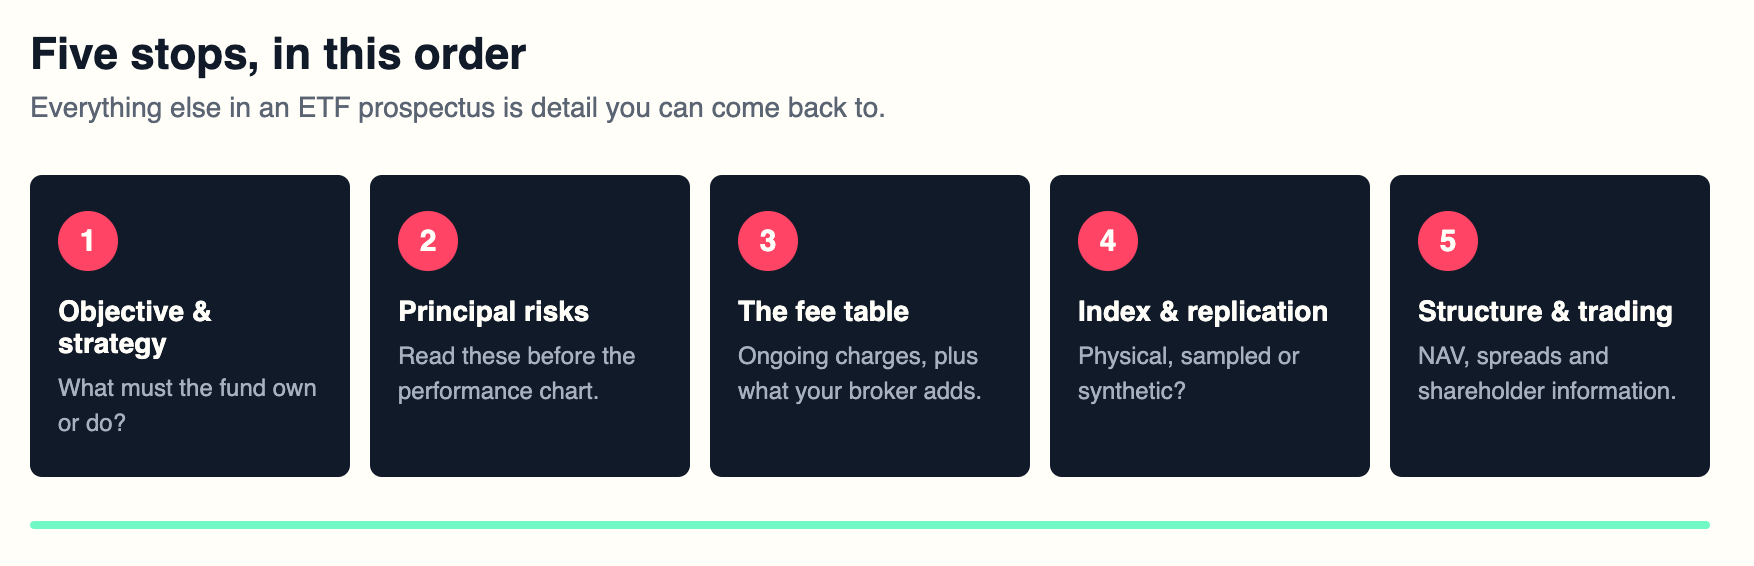
So here is the short version of how to read an ETF prospectus. Start with the investment objective and strategy. Move to the principal risks. Then the fee table, then the index and replication method. After that, check the fund’s structure, its trading features and its shareholder information.
Five stops, in that order. Everything else is detail you can come back to.
One thing to sort out before you begin. A US prospectus and an EU key information document do related jobs under different legal frameworks. If you are buying in Europe, the key information document is the one written for you.
Which Document Are You Reading?
Fund providers publish several documents, and they are not interchangeable.
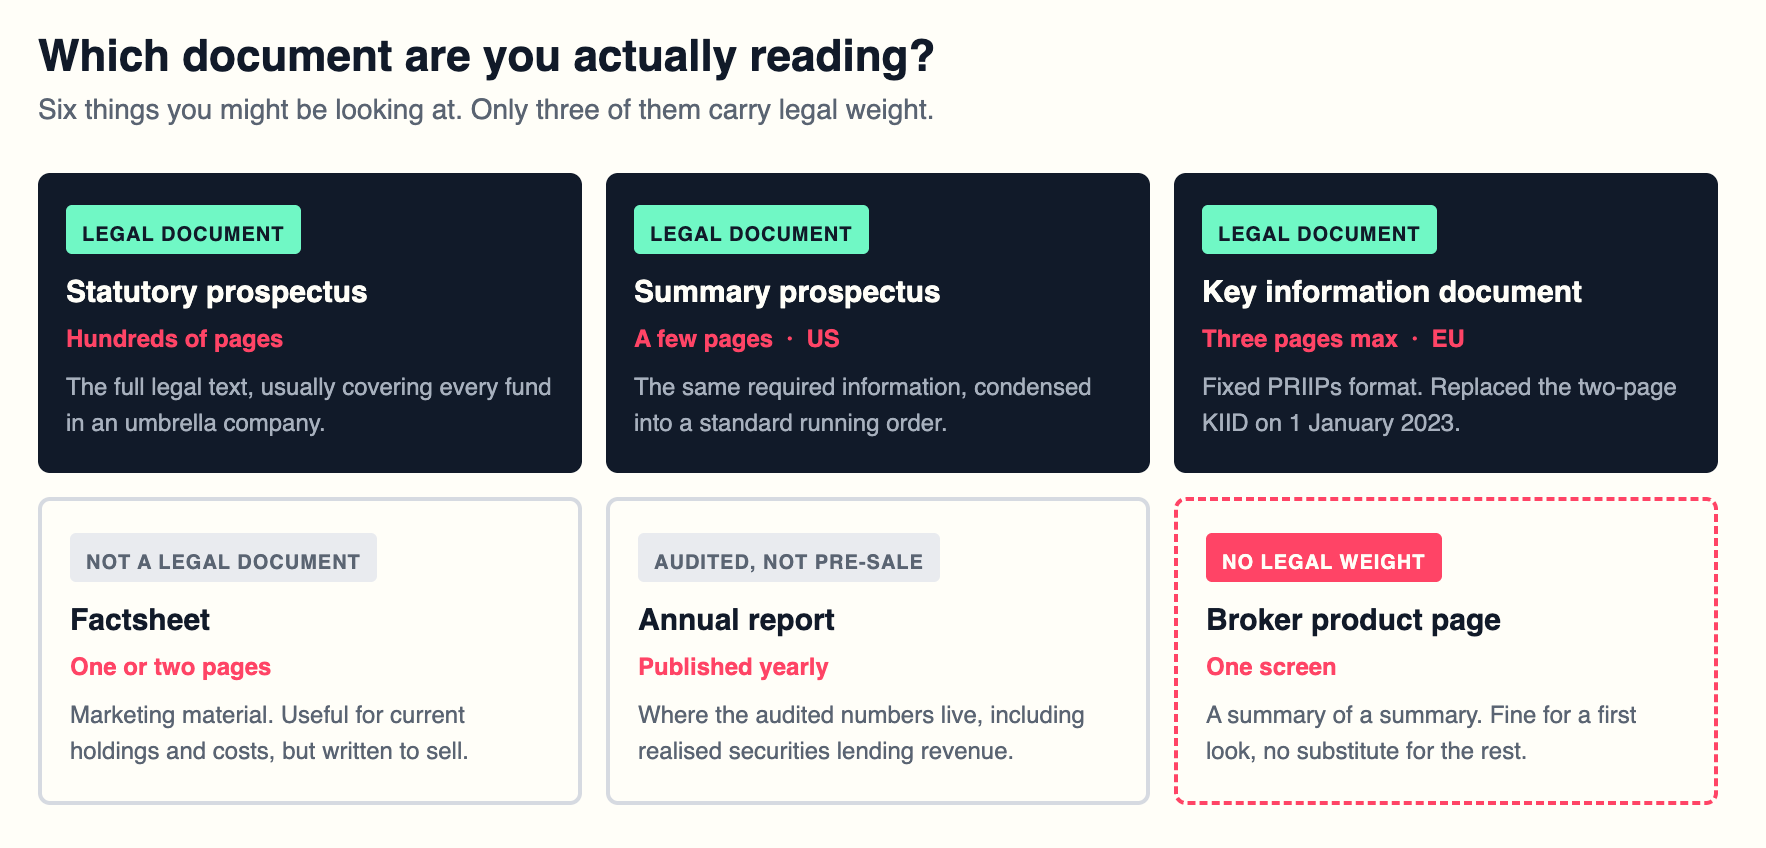
The statutory prospectus is the full legal text. It can run to hundreds of pages and usually covers every fund in an umbrella company. The summary prospectus, used in the US, condenses the same required information into a few pages.
In Europe the short document is the key information document, capped at three pages and following a fixed format set by the PRIIPs regulation.
That format changed recently. UCITS funds spent years publishing a shorter two-page document called the KIID, or key investor information document, under an exemption from the PRIIPs rules. That exemption ran out at the end of 2022. Buy a UCITS ETF as an EU retail investor today and you get the three-page KID. Older versions still circulate online, so check what you have actually downloaded.
Then there is the factsheet, which is marketing material, and the annual report, which carries the audited numbers.
A product page on a broker’s website is none of these. It is a summary of a summary, and it carries no legal weight.
Where Crypto ETPs Fit
Worth knowing if you have looked at crypto products in Europe: most of them are not ETFs.
UCITS rules require a fund to spread its holdings across multiple assets, which rules out a single-coin product. European spot crypto exposure therefore tends to arrive wrapped as an exchange-traded note or exchange-traded product.
Those still publish a prospectus and a KID. The legal structure underneath is different, though, and so is what backs your claim on the asset. Read the structure section carefully before assuming a crypto ETP and an equity ETF work the same way.
Alternatively, Venga has more information on crypto ETFs and direct crypto ownership.
Start With the ETF’s Objective and Strategy
The investment objective is usually one sentence. It is also the most important sentence in the fund prospectus.
Here is a real one, from the iShares Core S&P 500 UCITS ETF. The objective is to deliver the net total return performance of the benchmark index, less the fees and expenses of the fund.
Read that again. The fund is not promising to match the S&P 500. It promises to match the index minus what it costs to run. Those are different things, and the gap between them is what the fee section is really about.
The strategy section then tells you how. Which index, which assets are eligible, how the manager replicates it, and how much room they have to deviate.
Translate all of it into one plain question. What must this fund actually own or do to pursue its stated investment objective?
If the strategy section does not make that clear, that is information too.
Fund Domicile, Provider and Other Key Parties
An ETF is not one company. It is a stack of them.
The legal fund is often a sub-fund inside an umbrella company registered somewhere specific, commonly Ireland or Luxembourg. Domicile determines which regulator supervises it and how withholding tax on its holdings gets treated.
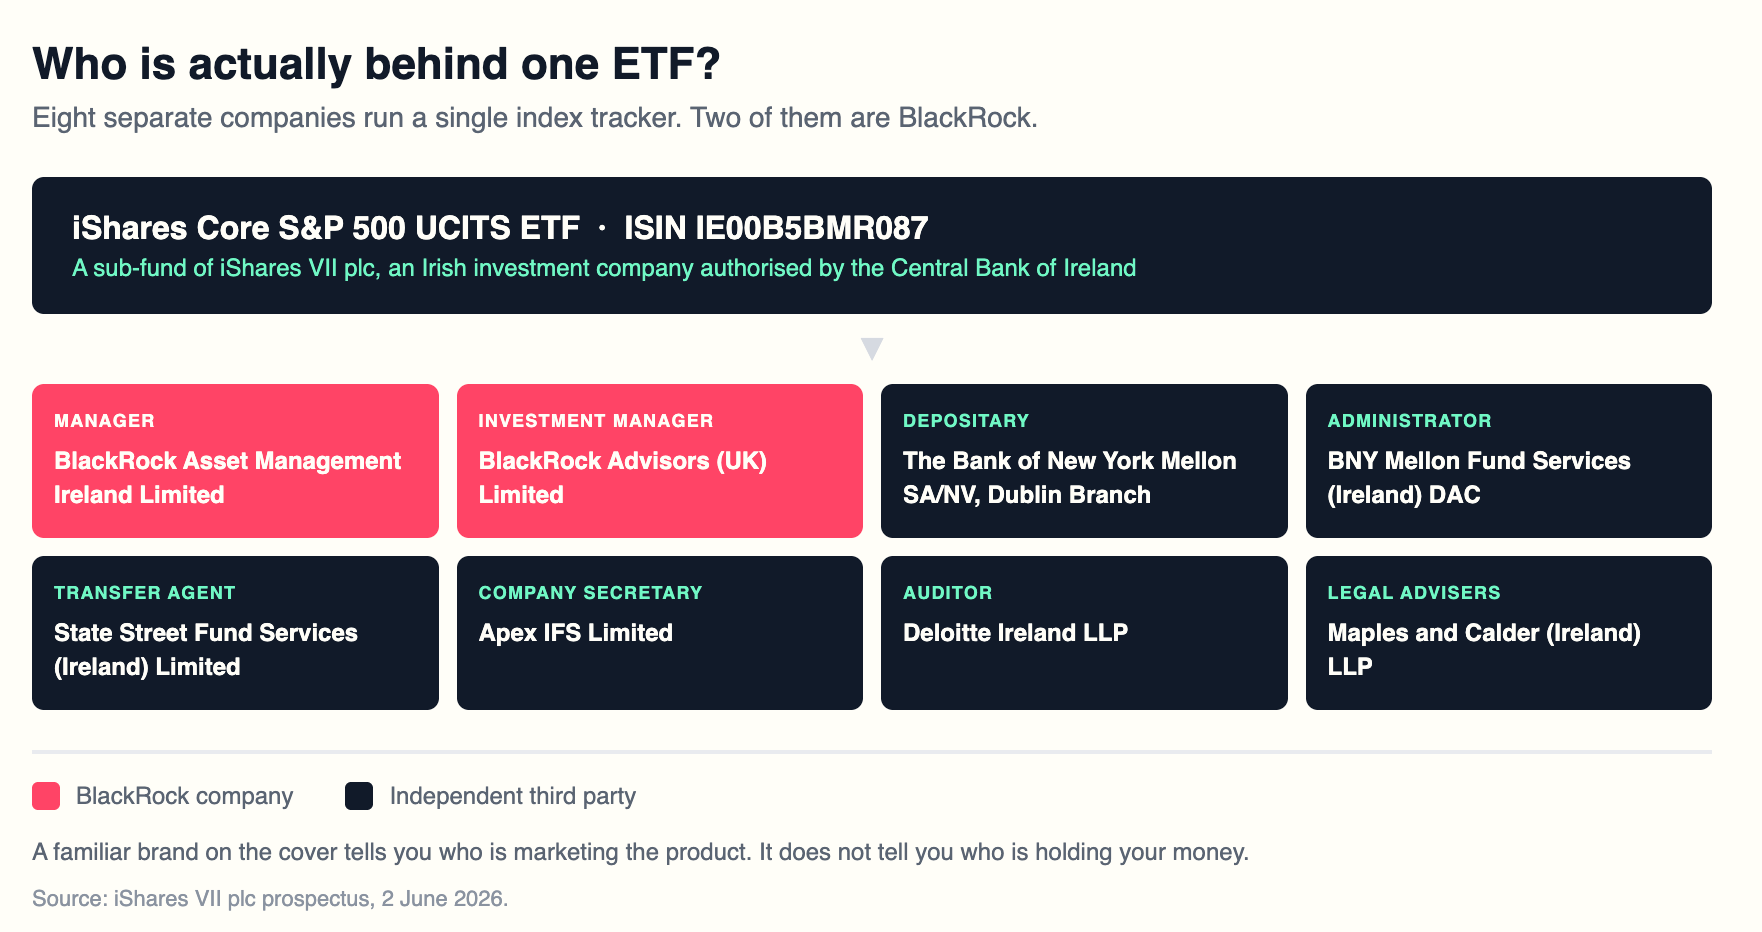
Then come the service providers. A management company runs the fund. A separate investment manager may handle the portfolio. A depositary or custodian holds the assets. An administrator calculates net asset value. A transfer agent keeps the register. An auditor signs off the accounts. An index provider licenses the benchmark.
The prospectus names all of them, usually in a directory near the front.
Take the iShares Core S&P 500 UCITS ETF again. Its prospectus lists eight separate entities. Two are BlackRock companies. The other six are not.
A familiar brand on the cover tells you who is marketing the product. It does not tell you who is holding your money.
Index, Active Management and Replication
Replication is how a fund tries to match its benchmark. There are three ways to do it, plus one approach that does not try.
Full physical replication means buying every constituent of the index at roughly its index weight. It is the most straightforward version, and it works well in liquid markets like large-cap US equities.
Sampling means buying a representative subset instead. Funds do this when an index has thousands of illiquid components, as broad bond indices do. Trading costs stay lower. Tracking error tends to rise.
Synthetic replication means the fund holds a basket of assets and enters a swap with a bank, which pays the index return. Tracking is often tight. In exchange you take on counterparty exposure to whoever sits on the other side of that swap.
Active ETFs skip benchmark-matching and let a manager choose. Tracking error stops being a defect and becomes the entire idea.
The prospectus states which approach applies. The risks section then spells out what that choice brings with it.
Derivatives, Securities Lending and Collateral
A plain index tracker can still use derivatives and lend out its holdings. The prospectus says so. Hardly anyone reads that part.
The mechanics of securities lending are simple enough. A borrower takes shares from the fund. The fund holds collateral against them and earns a fee while the loan runs. That income can offset running costs. The risk is a borrower defaulting at the same moment the collateral has fallen in value.
Four things to look for:
- How much of the fund can be on loan at once.
- How collateral is valued and where it is held.
- Who the borrowers are.
- And how the lending revenue gets divided between the fund and the manager.
That last split varies a lot between providers, and it is disclosed.
Derivatives turn up for currency hedging, for cash management, and sometimes for the exposure itself. If a fund offers hedged share classes, forwards are involved somewhere.
None of this makes a fund unsuitable. It means the simple product is doing more than its name suggests.
Read the Principal Risks Before the Performance Chart
Performance charts are easy to read and describe the past. The risks section is harder to read and describes the future. Most people do it the other way round.
The ETF risks set out in a prospectus tend to fall into a handful of groups.
Market risk is the obvious one. The index falls, the fund falls. Concentration risk is what happens when a few holdings dominate. Liquidity risk covers the underlying assets becoming hard to trade. Currency risk applies whenever a fund holds assets denominated in something other than your own currency.
Then come the structural ones. Derivatives risk, counterparty risk, securities lending risk, operational risk. None of these depend on the market going down.
A prospectus lists ETF risks that apply across every fund in the umbrella, so some will not apply to yours. The KID compresses all of it into a summary risk indicator scored from 1 to 7, though that number is built mostly from past volatility.
Read the long list once, properly. You only have to do that the first time.
Understand the Fee Table and Total Cost
ETF fees arrive in layers, and only some of those layers appear in the fund’s own documents.
The headline number is the ongoing charges figure in Europe, or the expense ratio in the US. Same idea either way. It is the annual percentage deducted from fund assets to cover management, administration, custody and audit. You never receive a bill for it. It comes out of performance quietly.
Below that sit transaction costs, which are the dealing costs the fund itself incurs when it trades. The KID separates these out. Portfolio turnover tells you how much trading is going on to generate them.
Then there are the ETF fees that never appear in the ETF prospectus at all. Your broker’s commission. The bid-ask spread when you buy. Any currency conversion charge. Those sit between you and your broker.
Here is what the headline number does over time. The table below assumes a €10,000 holding and no growth at all, which isolates the effect of the charge itself.
What an annual charge costs on a €10,000 holding
Seven euros a year against fifty sounds trivial. Over twenty years on the same starting sum the gap is roughly €815, before counting whatever that money would have earned along the way.
Check Holdings, Concentration and Rebalancing
ETF holdings do not sit still. Every figure published about them comes stamped with an as-of date. Check it before relying on it.
The prospectus gives you the rules. The factsheet and the daily holdings file tell you what the fund owns right now.
The rules are worth knowing. Index-tracking UCITS funds may hold up to 20% of net asset value in securities issued by a single body, and that ceiling can rise to 35% for one issuer in exceptional market conditions. A broad index fund will normally sit far below that. It is still the limit you agreed to.
Look at the top ten ETF holdings and what share of the fund they represent. In a market-cap weighted index, that number has been climbing for years.
Rebalance frequency matters too. Quarterly, semi-annual or annual reconstitution determines how quickly a fund follows changes in its index, and each rebalance carries trading costs that land inside the fund.
Performance: What the Numbers Include and Exclude
Performance figures are calculated on a defined basis, and the definition sits in the small print.
Net returns are after the fund’s charges. Gross returns are before them. Comparing a gross fund figure against a net index figure will flatter the fund.
Most equity index comparisons use a net total return index, which assumes dividends are reinvested after withholding tax is deducted. For a European fund holding US shares, that is the honest benchmark, because the withholding tax is real money.
Watch the period too. A chart starting at inception looks different from one starting at the last market low. Neither is wrong, but the start date is a choice.
The distance between fund return and index return across a period is where tracking error becomes visible. A well-run tracker with a low expense ratio should sit close to its benchmark, though never exactly on it.
Past performance does not predict future results. Regulators make providers print that line because it happens to be true.
Trading and Shareholder Information
Net asset value is what the fund’s holdings are worth. Market price is what somebody will pay you for a share right now. Usually they are close. Occasionally they are not.
When market price sits above NAV, shares trade at a premium. Below it, a discount. Authorised participants create and redeem shares directly with the fund, and that mechanism is what keeps the two numbers tethered to each other.
The prospectus describes that process at a high level. What matters for you is that it works better in liquid markets and during normal trading hours.
The bid-ask spread is your real entry cost. On a large ETF it is negligible. On a thinly traded one it can exceed a full year of ongoing charges.
Distribution policy lives here too. Accumulating share classes reinvest income inside the fund. Distributing share classes pay it out to you.
So does fund closure. Providers can merge or wind up a fund, and the prospectus sets out what notice you get and how proceeds come back. It happens more often than people expect.
Currency, Distributions and Tax Information
Three different currencies can apply to the same ETF, and mixing them up is common.
Base currency is what the fund reports in. Trading currency is what a particular listing is quoted in, and one fund can be listed in several. Currency exposure is what the underlying assets are actually denominated in, and only that last one affects your return.
A fund holding US shares gives you dollar exposure whether you buy the euro listing or the dollar listing. The listing currency changes nothing.
Hedged share classes are different. They use forward contracts to strip out the currency effect, at a cost that shows up in ongoing charges.
On tax, the fund prospectus covers taxation at fund level rather than yours. Your own treatment depends on where you live.
For a Spanish resident, one point is worth knowing as at 2026. Investment funds benefit from the traspaso regime, which lets you switch between funds without triggering a taxable event. ETFs generally do not qualify. Each sale is a disposal that feeds into the savings base of your income tax return.
Rates and rules change. Check the current position and take advice on your own circumstances.
US Prospectus vs EU KID: A Reader’s Map
Both documents answer the same questions. They answer them in different places, at different lengths, under different rules.
If you are buying a product offered in the EU, the KID and the fund prospectus supplied for that product are the ones written for you. A US summary prospectus for a similar-sounding American fund is not a substitute, and in most cases an EU broker cannot sell you that fund anyway.
Here is where each answer lives.
Where to find each answer: US prospectus and EU key information document
A Worked Example: Reading a Real ETF Prospectus
Take one fund and walk the method through. The iShares Core S&P 500 UCITS ETF, ISIN IE00B5BMR087, USD accumulating share class. It appears here as an illustration, not a recommendation.
Two documents. Its PRIIPs key information document carries the date 9 April 2026. The iShares VII plc prospectus is dated 2 June 2026 and runs to 209 pages, covering every fund in the umbrella.
Objective.Deliver the net total return of the S&P 500, less the fund’s fees and expenses.
Structure and parties.A sub-fund of iShares VII plc, an Irish open-ended investment company registered under number 469617 and authorised by the Central Bank of Ireland. Manager: BlackRock Asset Management Ireland Limited. Investment manager: BlackRock Advisors (UK) Limited. Depositary: The Bank of New York Mellon SA/NV, Dublin Branch. Administrator: BNY Mellon Fund Services (Ireland) DAC. Auditor: Deloitte Ireland LLP.
Replication.Physical, full replication. 504 ETF holdings against an index of 500, as at 1 September 2026.
Costs.Total expense ratio of 0.07% a year. On a €10,000 holding, roughly €7.
Securities lending.Disclosed and ongoing. Across the year to 30 June 2026, an average of 2.59% of assets sat on loan, peaking at 4.26%, with collateral held at 109.49% of the value lent. The fund keeps 62.5% of the lending income and BlackRock takes 37.5%.
Currency and income.Base currency US dollar. Accumulating, so income is reinvested rather than paid out. Listed in several currencies across exchanges including London, Xetra and Borsa Italiana, with hedged share classes offered separately.
That is the whole method, applied once. Every figure above carries a date, and every one of them will move.
When the Prospectus Leaves Questions Open
Some things a prospectus will not tell you.
Actual tracking difference over the last three years sits in the annual report and on the provider’s website, not in the ETF prospectus. Realised securities lending revenue gets reported after the fact. Current holdings are published daily and change daily.
The spread you will pay, and the commission on top of it, come from your broker rather than from the fund.
Tax is the big one. The prospectus covers the fund’s own tax position and offers general notes for various countries. It cannot tell a Spanish resident what a specific sale will cost them, because that depends on their other gains, their losses carried forward and their wider circumstances. A tax adviser can. The document cannot, and it says as much.
If a question survives the prospectus, the annual report, the factsheet and the provider’s website, that is usually the point to ask a professional rather than guess.
Conclusion: The Five Facts to Extract From Any ETF Prospectus
You do not need to read all 209 pages. You need five answers.
- Exposure. What is the fund trying to track, and what does it hold to do it?
- Implementation. Physical, sampled or synthetic? Does it lend securities or use derivatives?
- Principal risks. Which of the disclosed ETF risks actually apply to this fund, beyond the market going down?
- Total cost. Ongoing charges, transaction costs, and the ETF fees your broker adds on top.
- Exit mechanics. Market price against NAV, plus the spread you pay on the way out. And what the provider does if it decides to close the fund.
Answer those five and you understand the product. Whether it belongs in your portfolio is a separate question, and no prospectus is going to answer that one for you.
The method transfers, which is the real payoff. Learning how to read an ETF prospectus once means every fund after this one takes twenty minutes instead of an afternoon.
Disclaimer: The content provided in this article is for educational and informational purposes only and should not be considered financial or investment advice. Interacting with blockchain, crypto assets, and Web3 applications involves risks, including the potential loss of funds. Venga encourages readers to conduct thorough research and understand the risks before engaging with any crypto assets or blockchain technologies. For more details, please refer to our terms of service.