

Table of Contents
Most new trading platforms attach the colourful “zero commission” banner to attract users. However, zero commission does not mean your next trade is essentially free. The reality of the all-in cost of a trade goes much deeper than a marketing banner.
It includes a complex web of explicit charges wrapped together with the harsh, invisible gap between your expected and realised prices. A zero-commission label simply means your broker dropped one specific, highly visible line item. It absolutely does not establish that execution is free.
When calculating real trading costs, you must track every penny scraped away from the moment your capital leaves your bank account to the exact second your order finally fills. Your broker is running a business, not a charity.
Explicit Costs You Can Usually Find
The actual cost of trading on most platforms is often hidden deep in fee schedules. These documents are notoriously thick with footnotes.
You will typically encounter a matrix of maker and taker fees, withdrawal charges, network gas, and various funding charges. There might even be a sneaky currency conversion fee if you fund your account with a fiat currency they don’t natively support.
Always check the provider’s live schedule with a recent retrieval date. For instance, as of late 2024, rates and tier structures fluctuate wildly depending on the platform. Make sure you confirm your exact eligibility conditions before depositing a single euro.
Maker, Taker and Fee Tiers
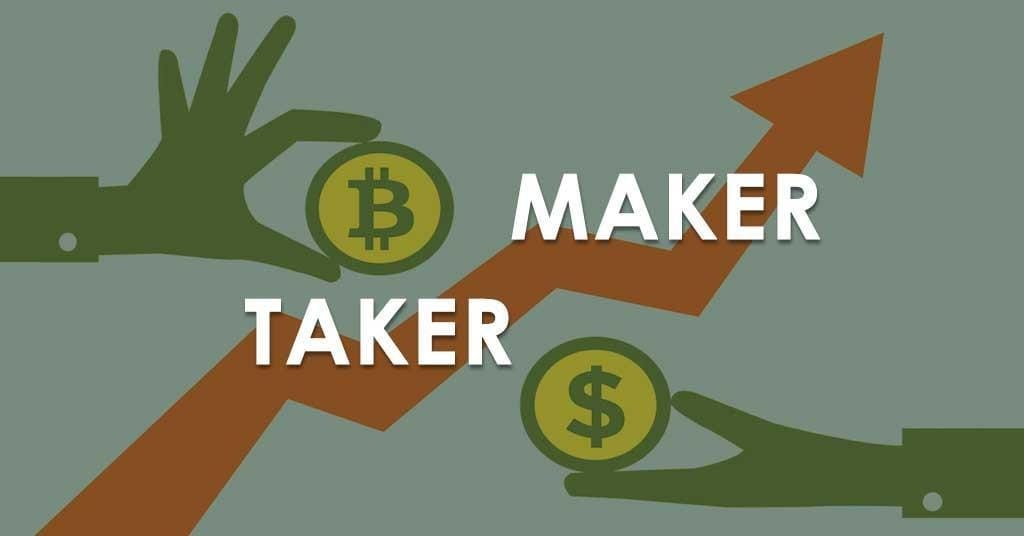
The behaviour of the order in the market will dictate your baseline trading fees. Most trading platforms will reward you by reducing your fees anytime you add depth to the order book (acting as a maker).
On the flip side, they will penalise you by charging higher fees when you remove that depth away from the market (acting as a taker). Your recent trading volume over a rolling 30-day window usually dictates which fee tier you sit in. The higher your volume, the lower the toll you pay.
If your limit order is instantly marketable, meaning its price crosses the spread and immediately matches an existing resting order, it removes liquidity. Consequently, the exchange categorises you as a taker and smacks you with the higher fee anyway.
Deposits, Withdrawals and Currency Conversion
Moving money is rarely a frictionless process. You have to separate the platform charges from the payment-provider costs and the underlying blockchain network fees. For instance, depositing EUR via a SEPA transfer might be completely free on the exchange side.
However, your local bank could still ding you €15 for processing an international wire transfer. Withdrawing Bitcoin? You will likely pay the exchange’s flat withdrawal fee plus a dynamic network fee reflecting current mempool congestion.
And if you deposit GBP into an account strictly denominated in USD, expect to be hit with a currency conversion fee. Under current standard conditions, these conversions can eat anywhere from 0.5% to 2% of your capital instantly.
The Bid-Ask Spread
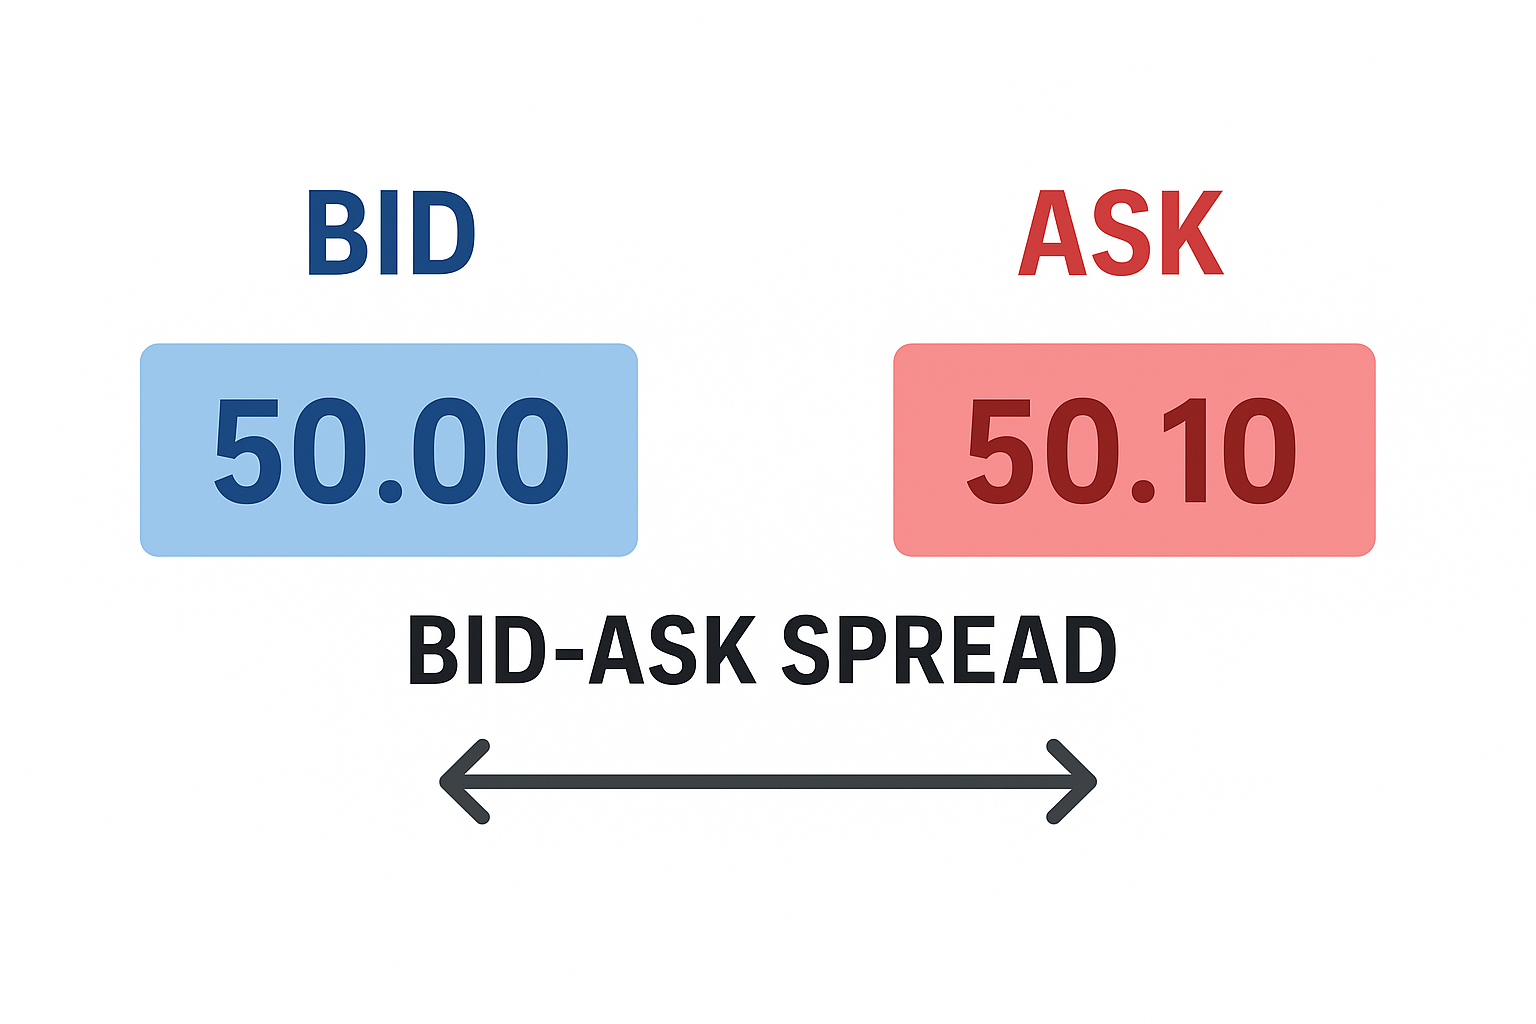
Let’s talk about the gap. The bid is the highest price a buyer will currently pay for an asset. The ask is the lowest price a seller will accept. The space wedged between them is known as the spread.
Here is the brutal reality check: you buy at the higher ask price and sell at the lower bid price. Imagine staring at an order book where the bid sits at €100.00 and the ask rests at €100.10.
The immediate round-trip effect of this gap is devastating to short-term trades. If you buy a share for €100.10 and panic-sell it a microsecond later, you only get €100.00 back. You just lost 10 cents without the asset’s true value moving an inch.
That quoted spread is not a static, reliable number. When liquidity dries up or market volatility suddenly spikes, market makers pull their orders back to protect themselves. As a result, the spread widens aggressively.
One-Way Cost vs. Round-Trip Cost
Placing a trade is only half the battle. Crossing the spread at entry and then doing it all over again at exit dramatically alters your break-even point. Say you buy a token with a nasty 1% spread on the way in. It costs you €1,000 to buy €990 worth of the actual asset.
To merely break even, the asset has to rise more than 1% to cover your initial entry spread. But wait, you also have to cover whatever spread exists when you finally decide to sell. Why might the spread differ between those two moments?
Market conditions change constantly. You might enter a trade during a calm, highly liquid afternoon session. But if you try to exit during a chaotic flash crash, that spread might have temporarily blown out to 3% or 4%.
Slippage and Execution Quality
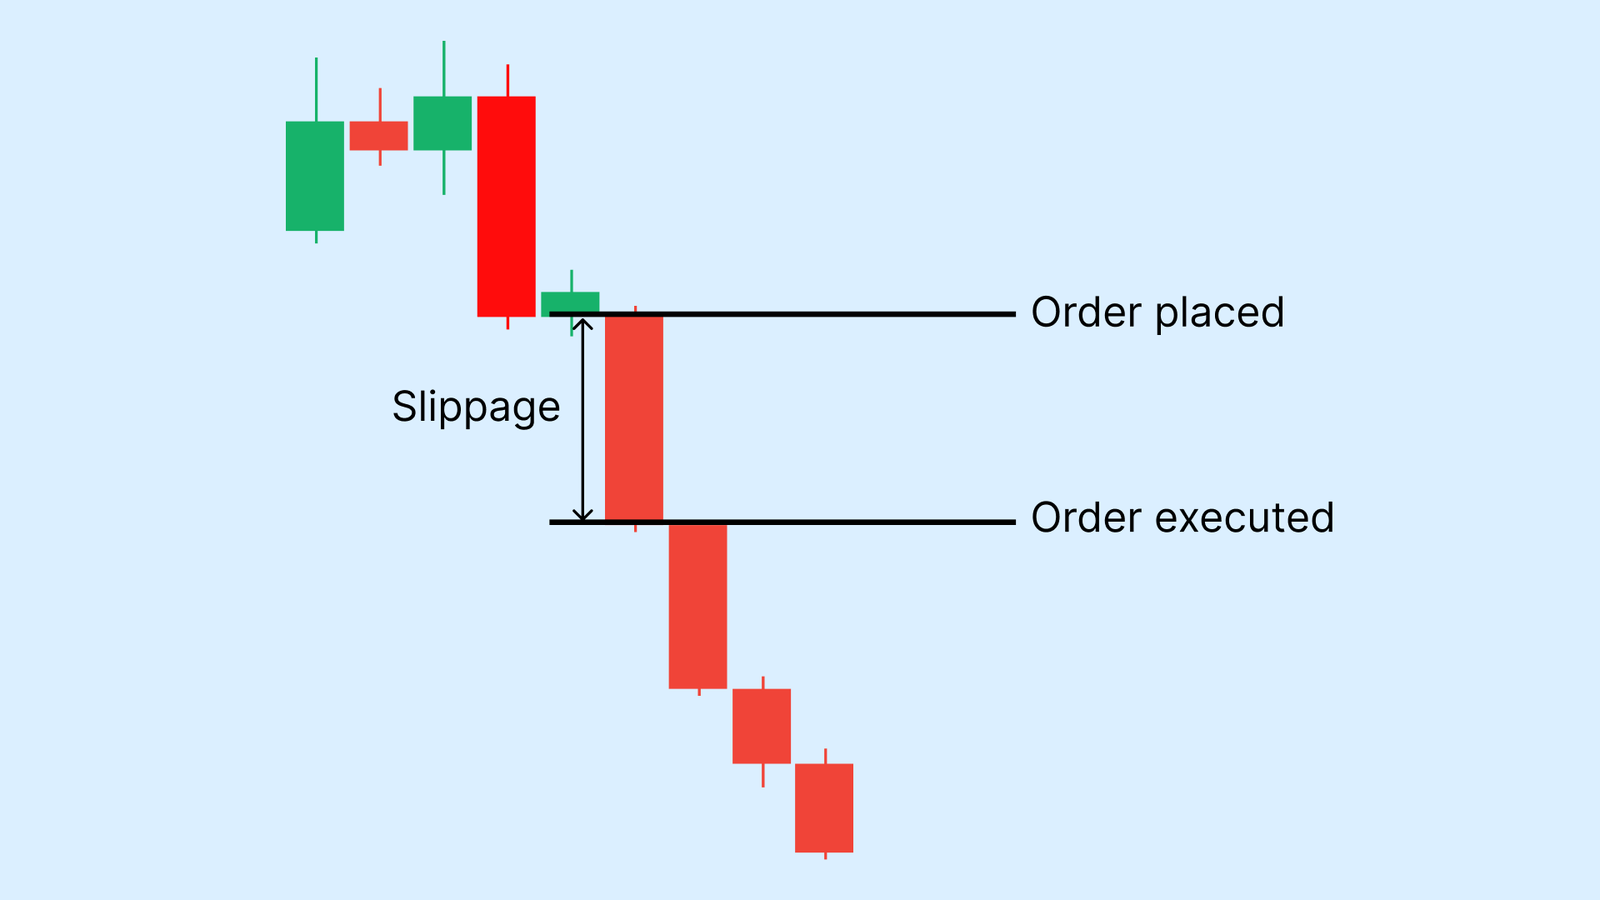
Sometimes the price you see on your screen is a complete mirage. Slippage happens when your final fill lands at a noticeably worse price than the quote you clicked. It is crucial to distinguish between three distinct concepts.
There is the expected price in your head, the quoted price on the screen, and the average fill you actually secure. Market impact is a prime culprit for this disconnect. If you dump a massive order onto the market, it eats through the best available price and chews aggressively into worse bids.
Sometimes you get partial fills. Half your order clears perfectly at the quote, but the rest slides down the order book. Latency delays and rapid price moves during breaking news also cause bad fills.
However, it is important to remember that not every adverse execution implies broker misconduct; sometimes the market simply moves faster than light.
Order Size, Market Depth and Price Impact
Size matters tremendously in financial markets. The very same asset can feature wildly different execution costs for a casual €100 ticket versus a €10,000 whale order. You must look at the order-book depth, not just the daily trading volume.
Daily volume is a rearview mirror, telling you what already happened. Order-book depth is the windscreen, showing you exactly what is coming next. If there are only €500 worth of sellers sitting at the current best ask, your €10,000 market buy will bulldoze right past them.
It will cascade up the order book, triggering worse and worse prices until the entire €10,000 is eventually filled. This phenomenon is pure price impact, and it acts as one of the largest hidden trading costs for sizable accounts.
Market, Limit and Stop Orders Change the Trade-Off
How you enter the market dictates your risk profile. Your order type fundamentally changes the trade-off between speed, price certainty, and risk. Here is how the three main types compare:
Remember, order behaviour differs across venues and products. A stop order on one exchange might trigger based on the last traded price, while another triggers based on the index price. Read the manual for your specific venue.
Other Costs That Appear Over Time
Fees don’t just end when you open a position. The longer you hold that position, the more hidden trading costs accumulate quietly beneath the surface. If you regularly trade derivatives or perpetual contracts, funding fees will silently drain or pad your account balance every few hours.
Borrowing interest for standard margin trades also ticks upward on a daily basis. Some traditional brokers even slap you with inactivity charges if you stop trading for a quarter. And do not forget standard custody fees for simply holding the asset on their infrastructure.
- Taxes: Don’t ignore the taxman. For instance, in Spain (as per 2024 tax regulations), crypto-to-crypto trades are taxable events subject to savings tax rates ranging from 19% to 28%. EU guidelines are continually evolving under MiCA regulations. Always source a localised, certified tax professional.
- Opportunity Cost: Every euro locked up as trading collateral is a euro that cannot earn a safe, predictable yield in a high-interest savings account.
How Leverage Makes Costs More Important
For many traders, leverage is a means of amplifying gains. While leverage amplifies potential profits, it also amplifies potential losses and trading costs.
Trading fees and funding fees are charged against your notional exposure in many products, not just your posted margin. If you put up €1,000 with 10x leverage, you are paying fees on the full €10,000 position.
This drastically magnifies the effect on your posted capital. A tiny 0.1% fee on €10,000 is €10. That is a full 1% of your actual €1,000 capital gone in an instant. Always verify the exact calculation in the current product documents before cranking up the leverage dial.
All-In Cost Calculation
Let’s build an original, step-by-step worked example to highlight the massive hidden trading costs iceberg. Imagine you want to buy and later sell €1,000 worth of a foreign asset.
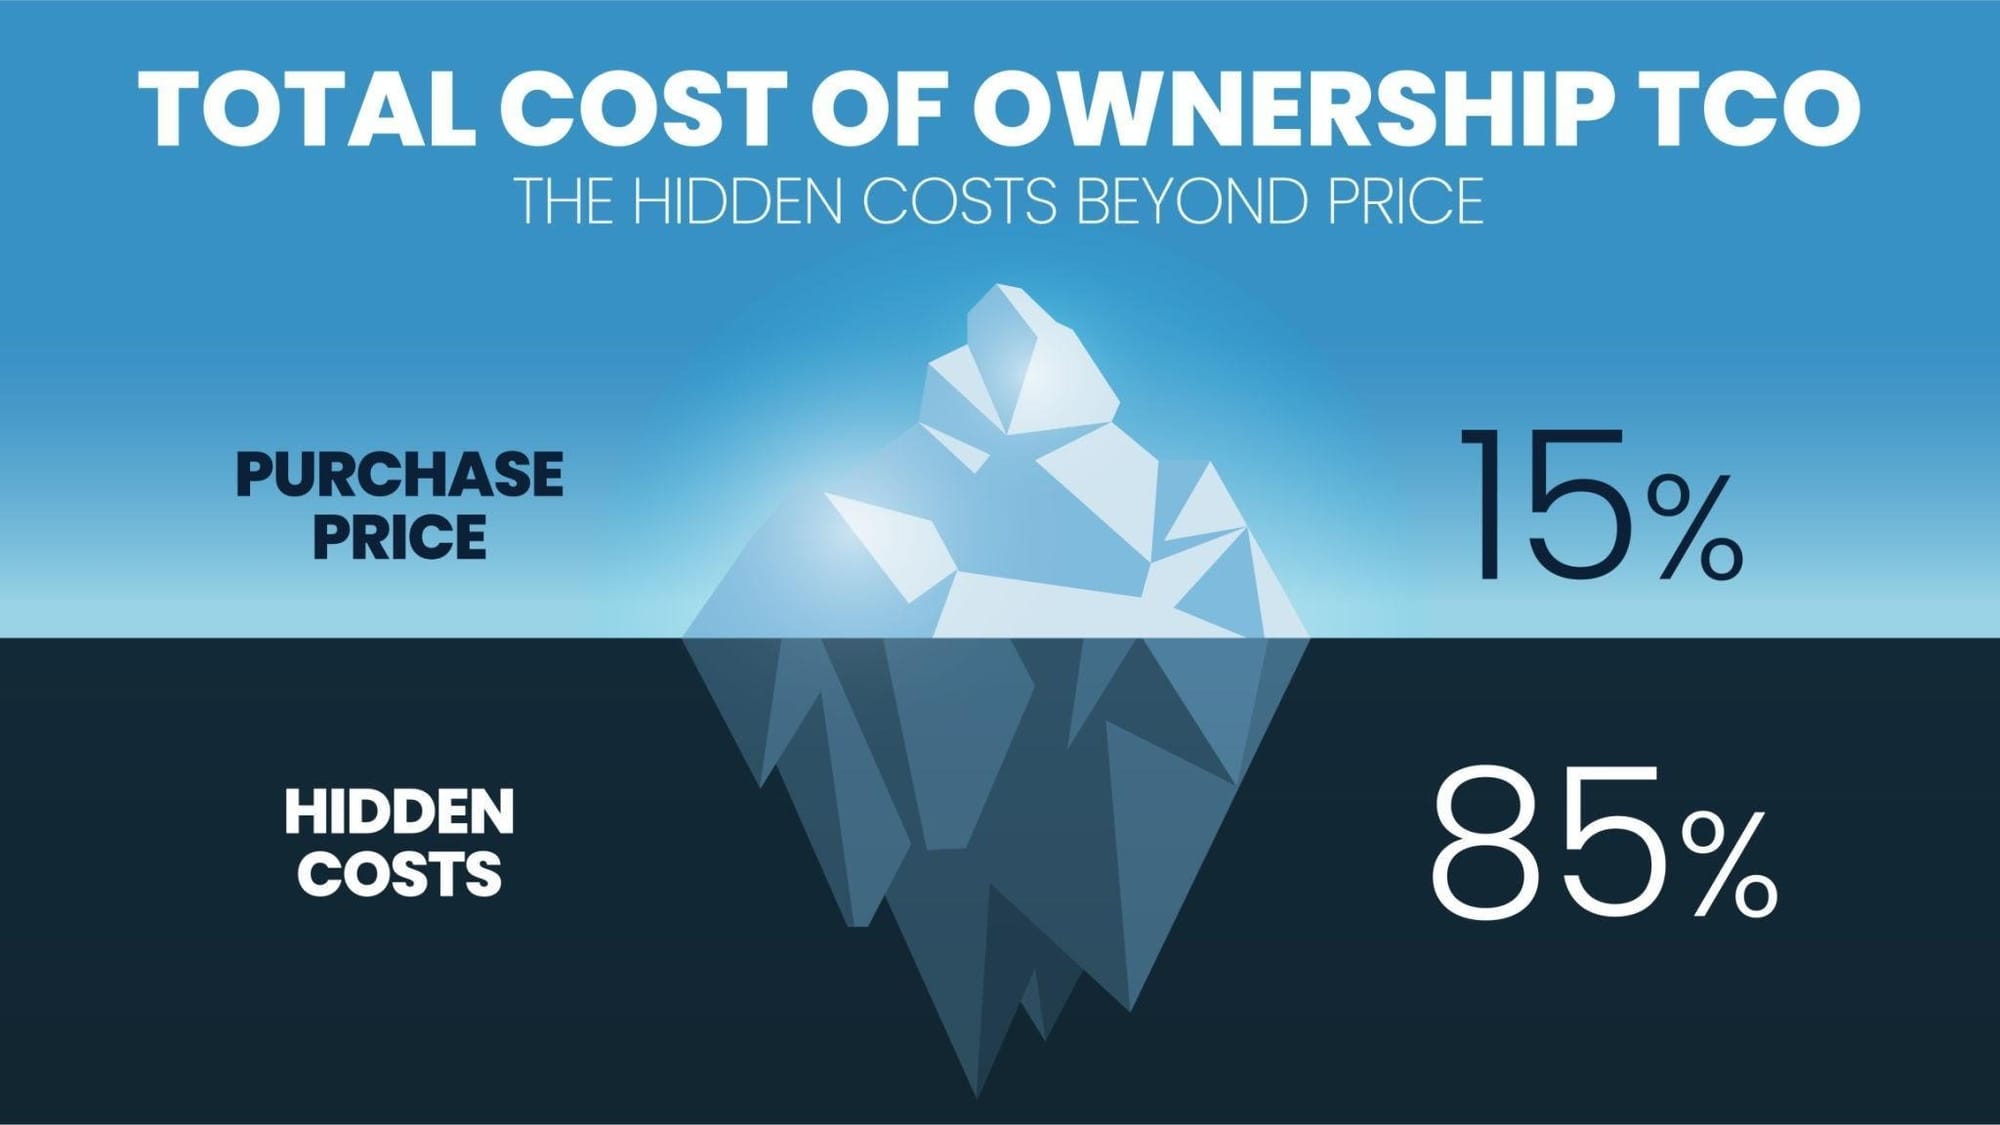
Assume you start with your native currency, euros, but need US dollars to access the deepest market. Here is the brutal math of a complete round trip:
- Initial Conversion: A 0.5% currency conversion fee on €1,000 equals a €5.00 cost.
- Entry Fee: A standard 0.2% taker commission on the buy side equals €1.99 (calculated after conversion).
- Entry Spread & Impact: You lose roughly €3.00 to the half-spread and minor slippage upon buying.
- Exit Fee: Another 0.2% taker commission when you eventually sell equals €2.00.
- Exit Spread & Impact: You lose €4.00 on the way out because volatility unexpectedly spiked.
- Return Conversion: Another 0.5% currency conversion fee to get your funds back into euros costs €4.92.
Your total all-in cost for this supposedly simple trade? Roughly €20.91. That means over 2% of your entire capital simply vanished in friction alone.
Why Small and Frequent Trades Feel the Cost More
If you are a scalper who opens a lot of positions, prepare to bleed capital. Fixed minimums, repeated spreads, and compounding friction absolutely destroy small accounts. If an exchange has a fixed €2 minimum commission, a €50 trade takes a massive 4% hit right off the bat.
If you open 10 positions, you’ll be wiped out in days from just fees. Even without fixed minimums, constantly paying the spread on frequent, small trades compounds your friction using a neutral comparison.
We won’t claim a universal break-even frequency, because every strategy is different. But the math doesn’t lie. Over-trading makes your broker rich and keeps you poor.
How to Compare Execution Across Providers
To actually compare hidden trading costs across providers, you need completely identical data points. You must compare the exact same asset, at the exact same time, using the identical order type, size, and venue. Look at the initial quote and then check your final execution price.
A harsh warning: screenshots from different moments in time do not prove better execution. Markets move in milliseconds. A screenshot of a tight spread at 10:01 AM tells you absolutely nothing about the spread at 10:02 AM.
When the Estimate Can Be Wrong
The estimated trading cost a platform gives you is just an educated guess. They remain highly fluid ranges until your order actually fills and the dust settles. This is a result of volatile macroeconomic events routinely shattering order books.
When a major inflation report drops, liquidity vanishes almost instantly, and suddenly thin markets gap wildly from one price level to the next. Hidden order-book depth can suddenly appear and absorb your market momentum.
Severe blockchain network congestion can aggressively spike your gas fees right as you hit the confirm button. You might even unexpectedly drop down a fee tier overnight due to a rolling volume calculation. Ultimately, a quoted execution price is merely a polite suggestion in a deeply chaotic market.
Conclusion: Measure the Full Path of the Trade
Don’t choose a trading platform simply because of its promised headline commission. In many cases, it’s a trap designed for amateurs. To find your true all-in cost, you must measure the full path of the trade. Make a summary of explicit and implicit costs from deposits to trading, closing, and withdrawals.
You have to account for the spread, the slippage, the conversion fees, and the funding rates. You also need to review live quotes, dig into the boring fee schedules, and audit your actual fills. This is because hidden trading costs can add up quickly, leading to much higher trading costs than advertised.
Disclaimer: The content provided in this article is for educational and informational purposes only and should not be considered financial or investment advice. Interacting with blockchain, crypto assets, and Web3 applications involves risks, including the potential loss of funds. Venga encourages readers to conduct thorough research and understand the risks before engaging with any crypto assets or blockchain technologies. For more details, please refer to our terms of service.