
Table of Contents
You likely have heard the term “volatility” in relation to investing and trading or when someone speaks about a stock, but what is volatility and what does it mean? Let’s dive in and explore the true meaning of the word.
What Is Volatility and How Is It Measured?
A lot of people out there think that volatility just implies that the market is going down. However, volatility doesn’t just describe market downturns or something that is negative overall. It is also not simply a sign that an asset is “dangerous” or scary like a ghost or a villain character from a movie, or a vampire. Volatility is a measure of how much or how often the price or returns of an asset, like a stock or a cryptocurrency, change.
People out there (even your friendly neighbor perhaps) often confuse volatility with loss, but it actually describes the size of movements— both up and down. The term volatility is not only used in a “bad” situation like when assets go down, but also when assets go up.

How Is Volatility Measured?
Volatility basically represents how much a stock or other asset’s prices swing around the mean price. There are a few ways to measure volatility. These include beta coefficients, option pricing models, and standard deviation of returns. Implied volatility explains how volatile the market will be and historical volatility explains the volatility in past time periods. As you may have already guessed at this point using that smart brain of yours, volatility is not estimated by intuition, but is instead measured using statistical methods and market indicators. The beta coefficient of a stock, cryptocurrency, or other investment security, is the measurement of its volatility of returns relative to the entire market. It is used to measure risk. If a company has a higher beta, it has greater risk but also greater expected returns.
Option Pricing Models are mathematical models that use variables to determine the theoretical value of an option. They provide investors with the fair value of an option. This knowledge allows investors to adjust their trading strategies.
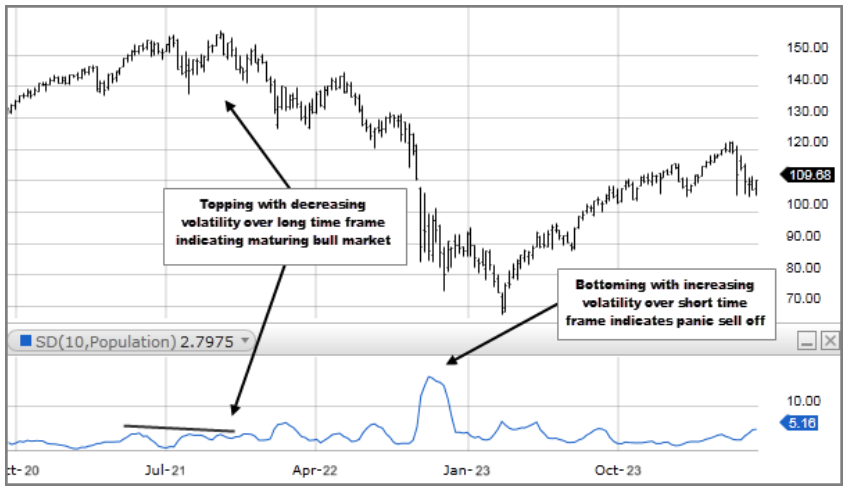
If volatility is how much something tends to move, standard deviation is a statistic, or the square root of variance. In other words its the square root of the average squared deviation from the mean. If this went over your head because you weren’t super skilled in mathematics in school like me, basically you can understand standard deviation by its relationship to volatility. Standard deviation is the way volatility is usually calculated in finance. However, standard deviation and volatility are not exactly the same thing. Volatility is not always standard deviation because you can use other methods to measure volatility (like beta coefficient and option pricing models) as well. Here’s a graph showing different volatility measurements:
What Does Volatility Really Mean in Investing?
Here’s a simple explanation that you don’t need to know formulas to understand. Higher volatility means prices move more sharply and less predictably over time. Lower volatility means movements are smaller and more stable. Volatility is unpredictability, but expressed through price behavior in financial markets. With low volatility, things are a bit more predictable. With high volatility it is very difficult to determine how prices will move.
Why Is Volatility Often Linked to Risk?
Volatility is often seen as a risk indicator because larger price swings make outcomes less predictable. When outcomes are less predictable, you can’t easily determine what might happen so it is considered more risky. However, volatility and risk are not identical. An asset can be volatile but still produce strong returns. Also, low volatility does not guarantee that an asset will perform well and increase in value. Just because an asset is less volatile does not mean that it will increase or that you will necessarily be able to predict its price movements.
Standard deviation of returns
As mentioned earlier, this is the most common way to measure volatility. It shows how much an assets returns deviate from their average. The larger the deviation, the higher the volatility.
Historical vs. implied volatility
To review, historical volatility looks at what prices did in the past and implied volatility looks at market expectations of future movements based on options pricing.
Beta and the VIX
As described above, beta compares an asset’s volatility to the market as a whole. The VIX is an indicator often referred to as the “fear gauge.” These are advanced tools for describing market volatility, so don’t worry if you are a bit confused. You don’t need to understand the math behind these to understand what volatility is and why it’s important.
What Does High or Low Volatility Tell You in Practice?
Volatility describes how uneven an investment journey might be. High volatility can lead to larger price falls, stronger price rebounds, and more opportunities for short-term trading. However, it may also place more emotional pressure on an investor. Lots of volatility can be stressful. Low volatility usually leads to smoother price movements that are easier to follow, but not necessarily better returns.
How Should Investors Use Volatility Without Misreading It?
You can use volatility as a helpful signal in your investing, but it is not an entire investment thesis. Other things should be considered as well, such as time horizon (how long you are planning to invest / short-term or long-term investing), liquidity, fundamentals, and how the asset fits into a specific portfolio. All of these metrics should be considered when making investment decisions. Focusing only on volatility is like focusing only on price. It’s very limiting and is unlikely to get you to your desired results. You should take multiple things into account and consider every aspect of an asset. Consider all aspects when developing your investment strategy.
Conclusion: What Should You Remember About Volatility First?
Keep in mind that volatility measures how much and how unpredictably prices move. However, it is not an indicator of whether an investment is a good investment or a bad one. To determine that you need to consider other metrics and do your research and then use the knowledge you gained to make a decision. Remember, volatility reflects the intensity of price changes, not their direction or long-term outcome. Think of volatility as the “shape of the journey” rather than the final result. This may help you understand volatility and how to incorporate it into your investment decisions better.
Disclaimer: The content provided in this article is for educational and informational purposes only and should not be considered financial or investment advice. Interacting with blockchain, crypto assets, and Web3 applications involves risks, including the potential loss of funds. Venga encourages readers to conduct thorough research and understand the risks before engaging with any crypto assets or blockchain technologies. For more details, please refer to our terms of service.