

Table of Contents
If you’ve spent any time at all trading, then you’ve probably come across the term 'open interest' (OI). While it might sound like a complex concept, it is simply the total number of outstanding derivative contracts that remain open at a stated time.
The OI tells you all the contracts that have not been settled or expired. They show all the live contracts, sitting on the exchange books right now. Every single contract out there fundamentally requires two parties. There must be a buyer, and there must be a seller.
Therefore, the open interest includes both long and short positions in completely equal measure. Because both sides must exist simultaneously for a contract to be valid, the OI is entirely neutral and cannot tell you the direction of the market. Let’s explore this metric in detail and why it is widely used and quoted by market analysts and traders.
How Open Interest Changes

OI changes when traders open new contracts, close existing ones, or transfer positions between each other. When a brand-new buyer and a brand-new seller agree to trade, a new contract is formed. The total count goes up by one. This is what the process looks like:
- [Trader A: Buys to Open] + [Trader B: Sells to Open] = Total Increases (+1)
- [Trader C: Sells to Close] + [Trader D: Buys to Close] = Total Decreases (-1)
- [Trader A: Sells to Close] + [Trader E: Buys to Open] = Total Unchanged (0)
If an existing buyer decides to cash out, they might sell their position to a completely new participant. The contract just changes hands. The total remains exactly the same. Only when two existing participants close or open their trades against each other does the number finally drop/rise.
Open Interest in Futures vs Options
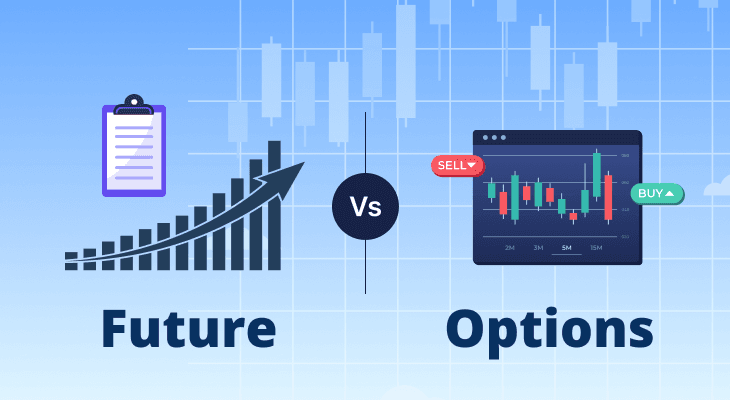
In traditional markets, futures contracts represent a strict, binding obligation. You agree to buy or sell a specific asset at a set future date. One contract equals one fixed unit of that underlying commodity or financial instrument.
Options, however, operate much differently. They grant you the right, but absolutely no obligation, to make that future trade. Because of this, options OI data can look very fragmented.
The numbers are divided by strike price, the exact expiry date, and whether the contract is a call or a put. Do not make the mistake of combining all these unlike contracts into one giant directional conclusion. You cannot mix a defensive put with an aggressive call and pretend they mean the same thing.
Open Interest vs Trading Volume

While they may seem similar, open interest and trading volume represent two entirely different concepts. Think of trading volume as the water flowing out of a tap over a specific period. It aggressively counts every single transaction that happens during the trading session.
Meanwhile, open interest vs volume is about comparing that daily, chaotic flow to the water currently sitting quietly in the bathtub. It represents the actual stock of outstanding contracts at any given moment.
A day could easily have massive trading volume because a few contracts changed hands dozens of times between high-frequency algorithms. Yet, the total outstanding tally might not change at all.
When debating open interest vs volume, remember that volume resets to zero at the closing bell. The outstanding contract count does not; it carries over to the next day.
Where the Data Come From
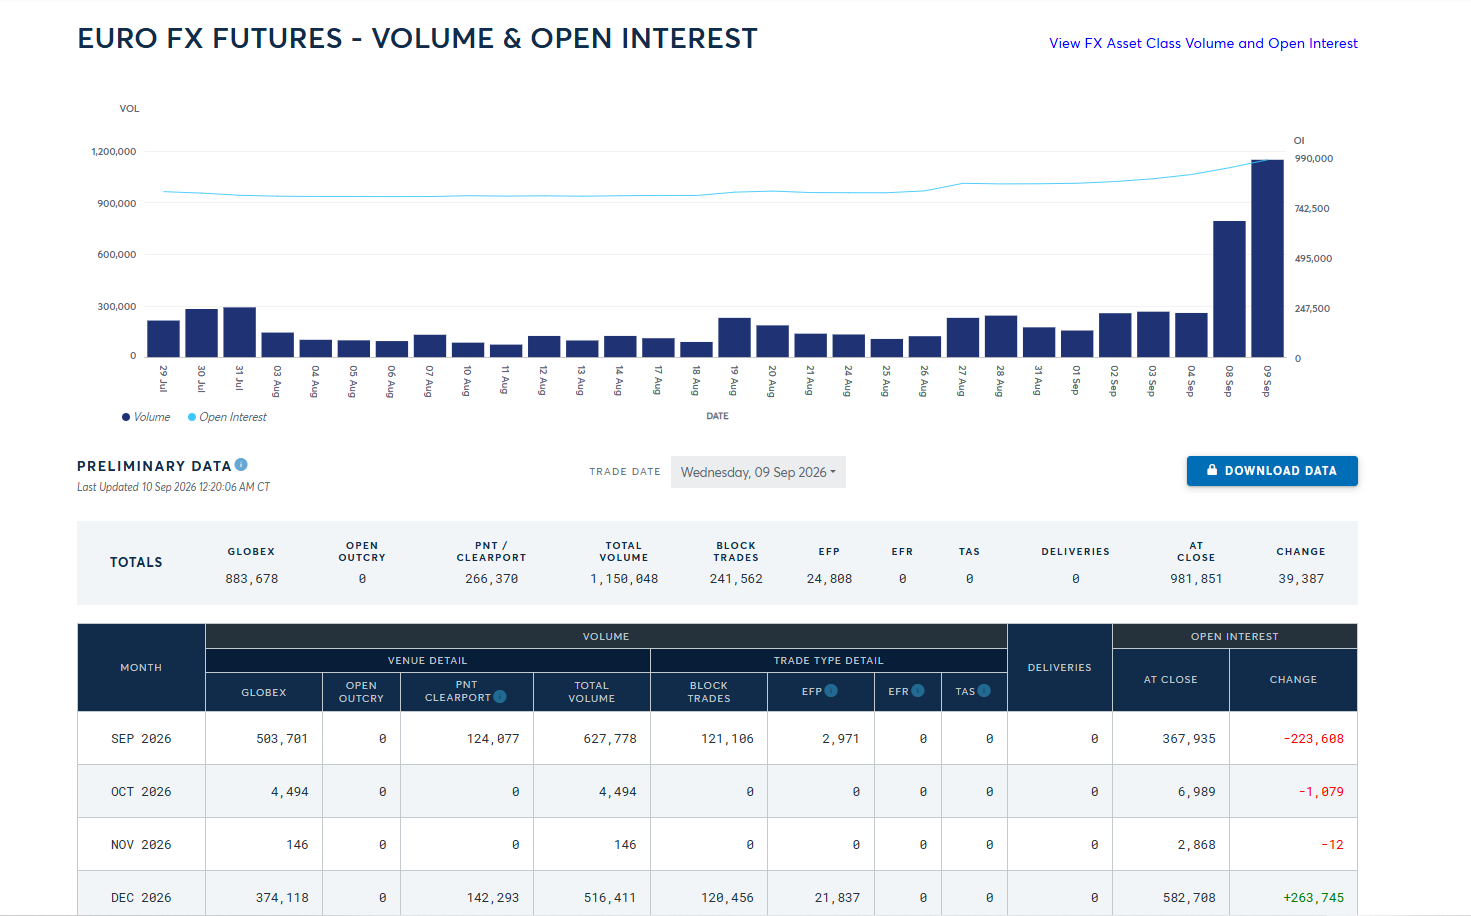
The OI data doesn’t just come out of thin air. In traditional finance, clearinghouses and major exchanges calculate them with rigorous precision. They aggregate this data at the contract level. Typically, you only get an official update at the end of the trading day.
You’ll find it buried in daily exchange reports from entities like the CME Group. However, where we get OI from in crypto differs in reality. Since crypto literally never sleeps, platforms update this data constantly. It flows 24/7.
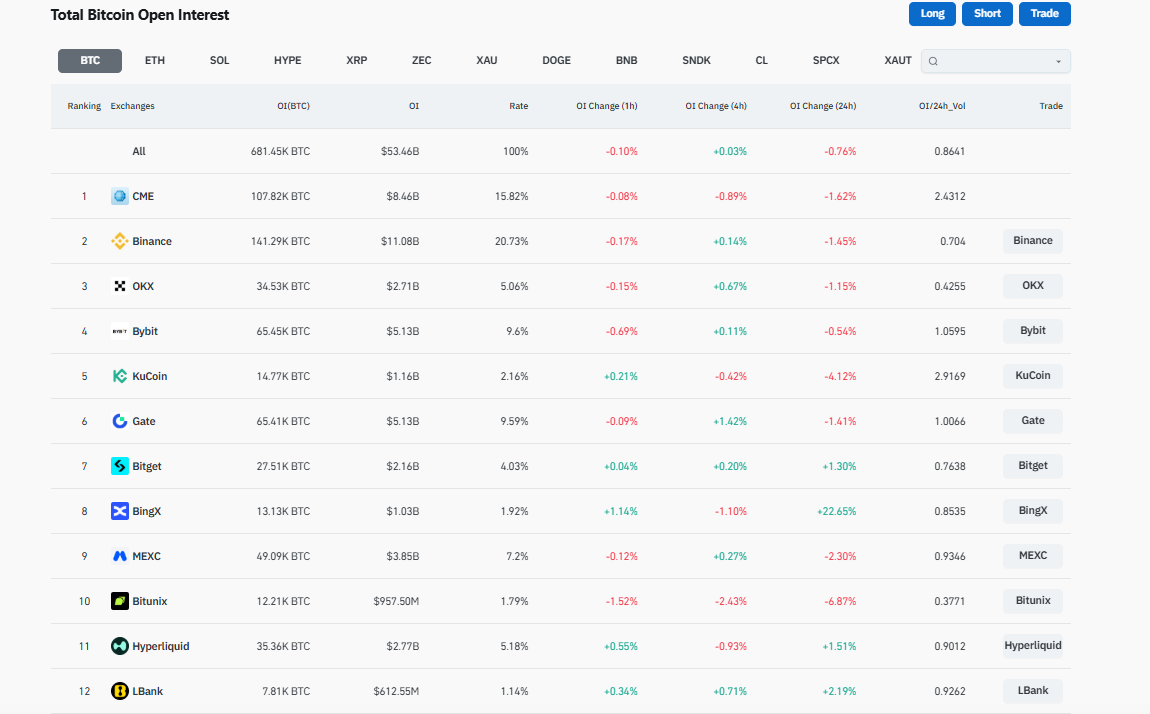
Because of this wild discrepancy, you must be meticulous. Require a precise source and a verified timestamp for every single chart you analyze.
Expiry, Rollover and Contract Migration
Every open interest has a specific date and time when it reaches its final lifespan, that’s its expiry. You probably have heard of open interest expiry moving the market, especially when there are huge funds set to expire on a specific date.
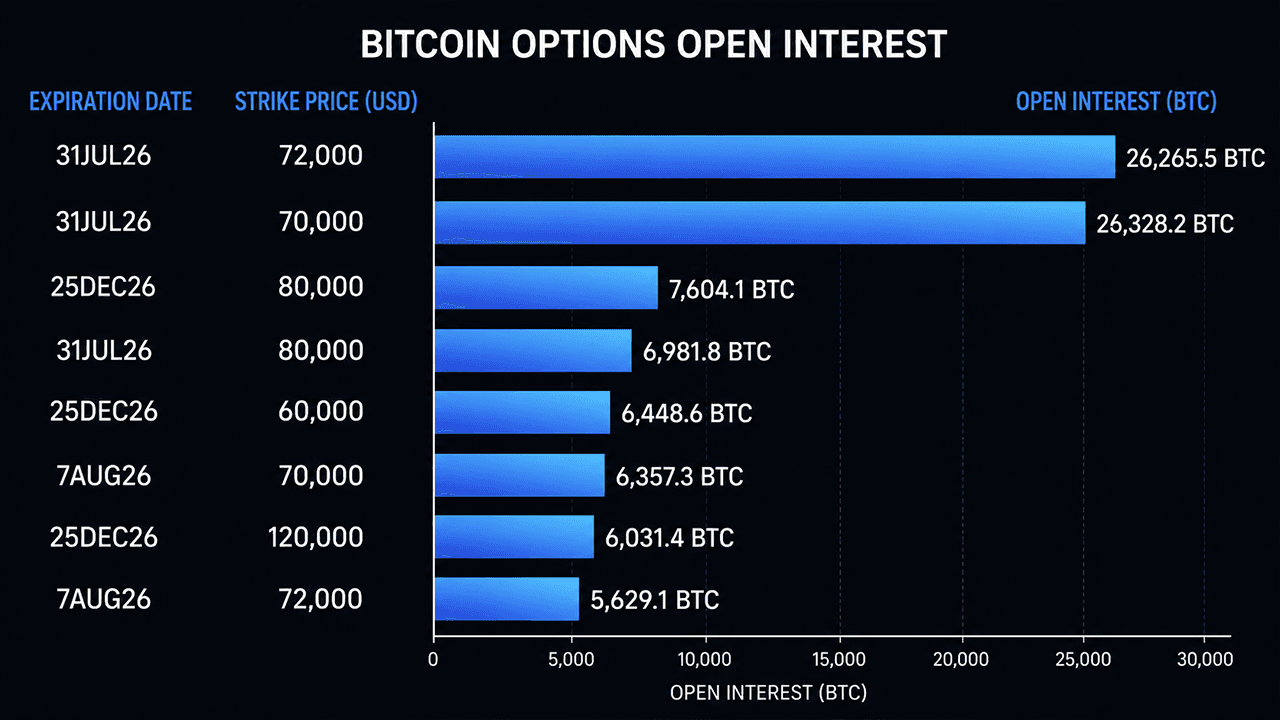
What actually happens when futures contracts approach their expiration date? The outstanding count drops like a heavy stone. Don’t panic when you see this on a chart. Traders aren’t fleeing the market in terror.
They are simply closing out their near-term positions and opening new ones further out in time. This routine phenomenon is known as rolling over. The total count will drastically fall in the expiring contract and simultaneously rise in a later one.
The participants haven’t left the market at all. Because of this migration, you must be careful. Require contract-level labels whenever an expiry artificially affects your data series.
Reading Price and Open Interest Together
Traders love to combine reading price and open interest to gauge market participation. But remember, these are possible interpretations of the market, not a sure way to tell where the market is going. If the price trend is rising alongside a rising outstanding OI contract count, it suggests something specific. It implies new money is actively entering the market to fuel the rally.
Conversely, if the price trend is rising but the contract count is actively falling, the rally might just be fueled by trapped short sellers scrambling to cover. That’s a classic short squeeze. Don’t jump to conclusions, though. The reality is often far more complex.
Those brand-new positions might not be aggressive speculators at all. They frequently belong to risk-averse hedgers, neutral market makers, and algorithmic arbitrageurs, just locking in a spread.
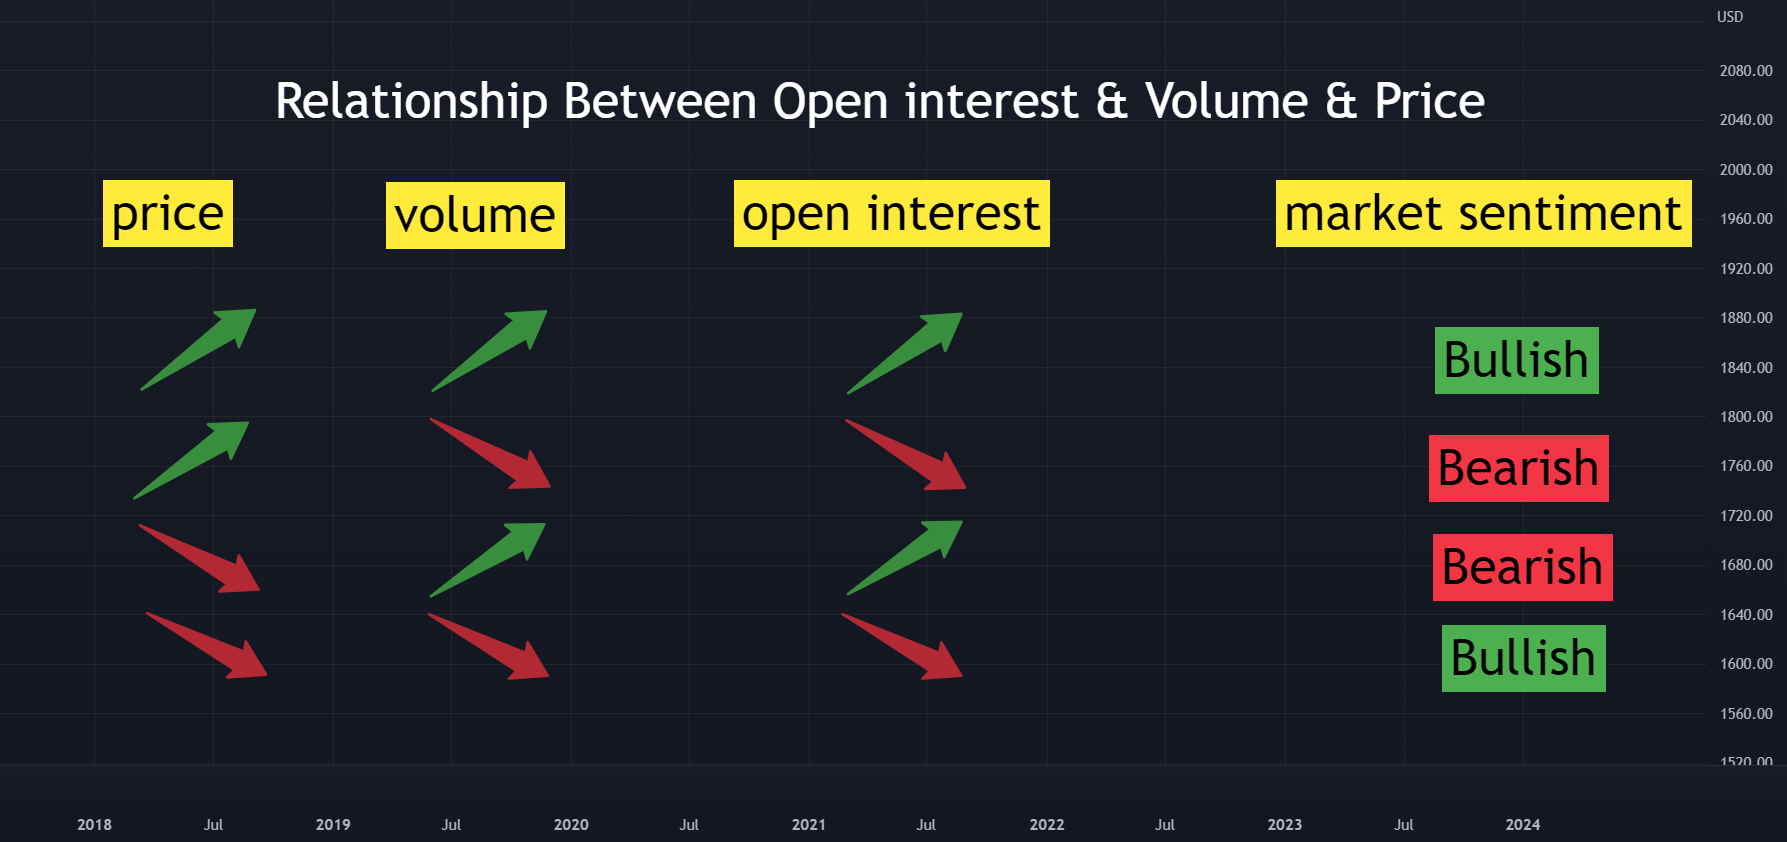
- Price Up + OI Up: Often viewed as a strong uptrend with new buyers arriving.
- Price Up + OI Down: Typically short covering; a potentially weak, unsustainable rally.
- Price Down + OI Up: Often a strong downtrend fueled by aggressive new short sellers.
- Price Down, OI Down: Generally long liquidation; a weak decline as tired buyers exit.
Open Interest Alongside Funding and Liquidations
To get the full picture of the market, you must look at open interest alongside funding rates and liquidation data. Make sure your datasets are perfectly timestamp-aligned. Comparing yesterday’s funding with today’s outstanding contracts is a sure way to lose money while trading.
Funding rates effectively tell you the cost of holding a position. Liquidations show you exactly when over-leveraged traders are forcefully ejected from the market by the exchange. If you see a massive spike in open interest during a highly leveraged price move, tread carefully.
It could absolutely mean reckless speculation is taking over. Alternatively, it could simply be delta-neutral hedge funds stepping in to harvest those juicy funding rates without taking any directional risk at all.
What Open Interest Can Suggest
Beyond the hype, open interest is a very reliable metric of broader market participation. It clearly shows you whether trading activity is expanding or contracting over weeks and months.
OI also highlights concentration, telling you if traders are heavily focused on one specific contract or expiry date. However, do not blindly equate a high count directly with market liquidity. A market can easily boast millions of outstanding futures contracts.
But if the bid-ask spread is terribly wide and the order book depth is tissue-paper thin, you will still get crushed on slippage. Always verify actual trading volume, spread, and order depth before assuming a market is safe to enter.
Common Interpretation Traps
As we explained earlier, OI is just a metric, and like other metrics, it is open to interpretation traps. One of the biggest traps is double-counting long and short positions. Some traders see 5,000 contracts and assume there are 10,000 individual directional bets placed. Wrong.
One contract equals one long and one short perfectly paired together. Another trap is confusing trading volume with the creation of new positions. High volume can simply be high-frequency day traders swapping the exact same contracts back and forth all afternoon.
Perhaps the most dangerous trap is treating a high count as inherently bullish. It’s not always the case. Also, ignoring the underlying contract size or the spot price can completely skew your historical comparisons and affect your predictions.
What It Cannot Tell You
Just like every metric, there is a limit to what Open Interest can tell you. Attempting to use this metric beyond its limitations is just a recipe for disaster.
For example, OI cannot identify every individual trader’s hidden motive. It will never predict the definitive, guaranteed market direction. It does not show the amount of hidden leverage being used behind the scenes.
Most importantly, it cannot guarantee liquidity during a flash crash, nor can it reveal whether the longs or the shorts are the smart money. It is crucial to distinguish cold, empirical facts from emotional sentiment.
Worked Example With Daily Data
We’ve gone into detail about what OI is, now, let us consider a practical example. Imagine looking at a daily chart for September futures contracts on a major commodity, like crude oil.
On Tuesday, the price aggressively breaks a major historical resistance level. Simultaneously, the daily trading volume surges by 40%, and the outstanding contract count rises by 15,000. This specific combination suggests fresh conviction.
New participants are actively putting fresh capital on the line to support the breakout. However, what if the price trend continued surging up on Wednesday, but the outstanding contract count suddenly dropped by 10,000?
You would need extra evidence to figure out why. You would look closely at a tight order book or negative funding rates to confirm if it was merely terrified short sellers throwing in the towel and covering their bad bets.
Open Interest in Crypto Perpetuals
Crypto markets introduce a fascinating twist called perpetual futures. These are specialized contracts that never expire. Because they never expire, you don’t have to deal with the messy rollover dynamics seen in traditional markets.
You have to understand the underlying units. Some exchanges quote their perpetual futures in stablecoins like USDT, while others use coin-margined contracts settled in Bitcoin or Ethereum.
However, the data of perpetual futures gets exceptionally complicated because it is fragmented across dozens of highly active global exchanges. Furthermore, you must rigorously distinguish between coin-margined and stablecoin-margined perpetual futures.
Their underlying risk profiles are completely different. If you blindly add up these incomparable feeds into one massive, global number without a strict methodology, your data is sure to be wrong.
A Method for Comparing Venues
When attempting to analyze open interest vs volume across different global exchanges, you need a strict, unforgiving methodology. Otherwise, your resulting data is utter garbage.
Before aggregating anything, specify the exact contract type. Specify the unit, the quote asset, and the exact conversion price. Always clearly state your venue coverage and the exact timestamp before running any aggregation math.
Why is this so critical? Because a dollar-denominated total will wildly change if the spot price of the underlying asset changes. This frustrating illusion can happen even when the actual, physical number of outstanding contracts hasn’t budged a single inch.
Conclusion
Open Interest is a powerful metric that shows the participation measure in any market. Unlike the rapid-fire, chaotic nature of trading volume, open interest offers a slower, broader, more strategic view of market participation.
It tells you if traders are actively gathering or quietly heading for the exits. While it’s a great metric, you must use it along with other metrics to get context. Without that vital context, OI just becomes another meaningless number flashing on a screen.
Disclaimer: The content provided in this article is for educational and informational purposes only and should not be considered financial or investment advice. Interacting with blockchain, crypto assets, and Web3 applications involves risks, including the potential loss of funds. Venga encourages readers to conduct thorough research and understand the risks before engaging with any crypto assets or blockchain technologies. For more details, please refer to our terms of service.