
Table of Contents
You spot a pattern that recurs without fail on a GBP/USD or any other pair, and it looks incredibly profitable on the chart. You’ve created a strategy using short and long-term moving averages to spot this pattern, but you need to test it to see if the golden cross happens in real time on the GBP/USD chart. That’s backtesting.
Backtesting simply means taking a set of rigid, fixed rules and throwing them at historical data. You do this to see what would have happened if you traded those exact rules in the past. It’s an estimate. A simulation.
It simply tells you what happened in the past, not what will happen tomorrow. So, your real goal in backtesting is to aggressively avoid overfitting. This simply means excessively tuning your strategy to past data that it learns from random noise instead of actual market data. Here’s how you can avoid overfitting when backtesting your strategy.
Turn the Idea Into Rules Before Looking at Results
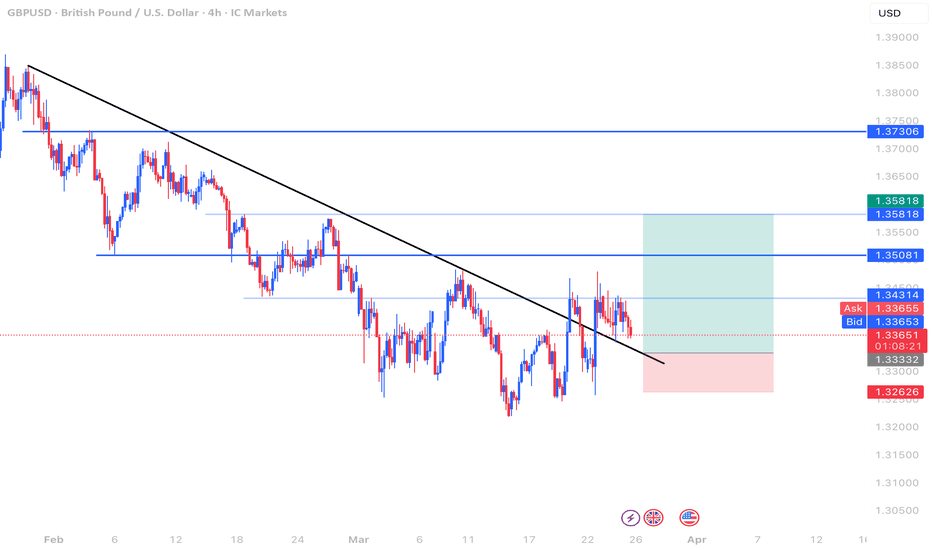
When reviewing a chart from three years ago, your brain already knows what happened next. You will naturally assume you would have caught the exact bottom. This is where backtest overfitting usually begins. To avoid this, you need rigid rules.
- Market: Are you trading GPB/USD, Bitcoin, or Apple?
- Timeframe: Is this a 15-minute chart or a daily one?
- Entry: Buy only if the 50-day moving average crosses above the 200-day moving average.
- Exit: Sell when the price closes below the 20-day moving average.
- Risk: Maximum 2% of total equity at risk per trade.
If a machine cannot understand your instructions, they aren’t rules. Set rigid rules, write it down, and lock them in. Garbage in means garbage out. The historical data you select dictates the validity of your entire experiment.
Choose Data That Match the Strategy
Your results are only as good as the numbers you feed into the machine. Selecting the right historical data is absolutely critical for an accurate backtest. A system tested only during a raging bull market is practically useless.
Your backtesting needs to include periods of high volatility, sideways chop, and slow, grinding trends to truly test an idea. Pay close attention to the venue and the candle resolution, too. If your strategy involves scalping, daily close prices are utterly useless to you. You need tick data or precise one-minute bars.
If your strategy is built around crypto, remember that most tokens have remarkably short histories. A coin born in a raging bull market hasn’t truly been tested. Furthermore, prices can vary wildly between crypto exchanges. Pick the exact feed you intend to trade on. Poor data quality creates a useless foundation.
Timestamps, Data Leakage and Signal Availability
This is where naive dreams go to die. Data leakage occurs when your backtest accidentally peeks into the future. When reviewing historical data, data leakage completely invalidates your findings. It renders the entire exercise pointless.
Here is a golden, unbreakable rule. An input can only be used after it would have been completely available in real time. For example, if you base a signal on a daily candle close, you cannot execute the trade at that exact same closing price.
The candle hasn’t officially closed until that precise second has completely passed. You must execute on the open of the next candle. This flaw, technically known as look-ahead bias, destroys credibility. Publication delays for economic data act the exact same way.
If a crucial earnings report drops at 8:30 AM, you cannot realistically enter a trade at the 8:30 AM price without experiencing wild slippage. Always model a delay to reflect reality.
Manual vs Coded Backtesting
A major decision you’ll need to make is either stare at charts for hours or let Python do the heavy lifting. When learning how to backtest a trading strategy, automation scales beautifully. Both methods, however, have their rightful place in backtesting.
Coding your system does not magically remove human assumptions. You still wrote the core logic. A flawed premise coded perfectly is still just a completely flawed premise. You need to choose the tool that fits your skill set and goals. Here’s how they stack up against each other.
Manual testing builds deep, intuitive screen time. Coded backtesting provides massive, statistically significant sample sizes. Choose wisely.
Position Sizing, Cash and Overlapping Trades
What exactly happens when your trading strategy generates three separate buy signals on the exact same day? Can you mathematically take them all? This is why it is important to consider position sizing, your available cash and overlapping trades.
You must explicitly model whether several trades can be open simultaneously. Decide if you are going to risk a fixed dollar amount or a dynamic percentage of your total equity. Also consider if you will actively reinvest profits or routinely sweep them into cash.
If your backtest assumes you can confidently put 100% of your account into five overlapping trades, you’ve created a mathematically impossible, bankrupt scenario. You cannot spend money you simply do not have.
Respect your portfolio constraints. If you ignore available cash balances and broker margin requirements, your results mean absolutely nothing. You must treat the historical simulation like a real-world bank account.
Run a Basic Manual Backtest
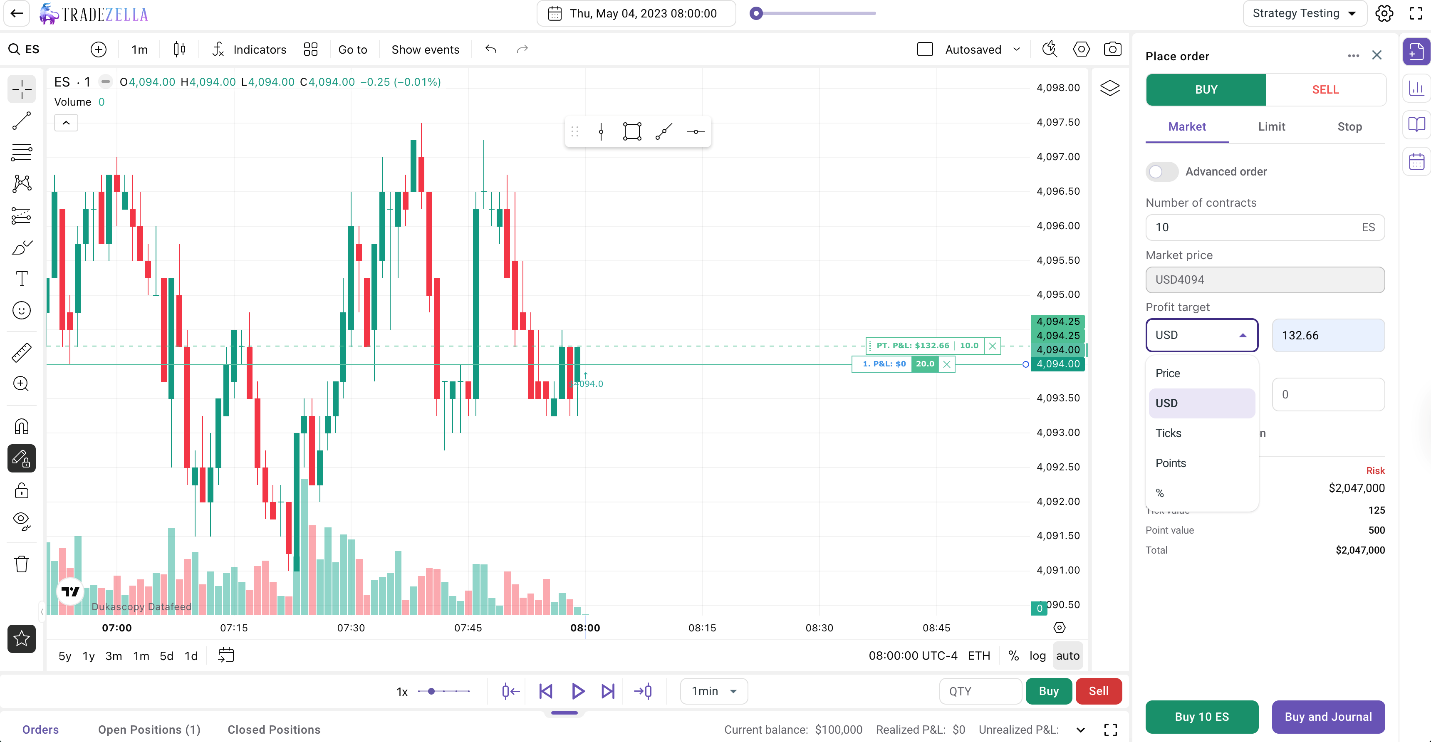
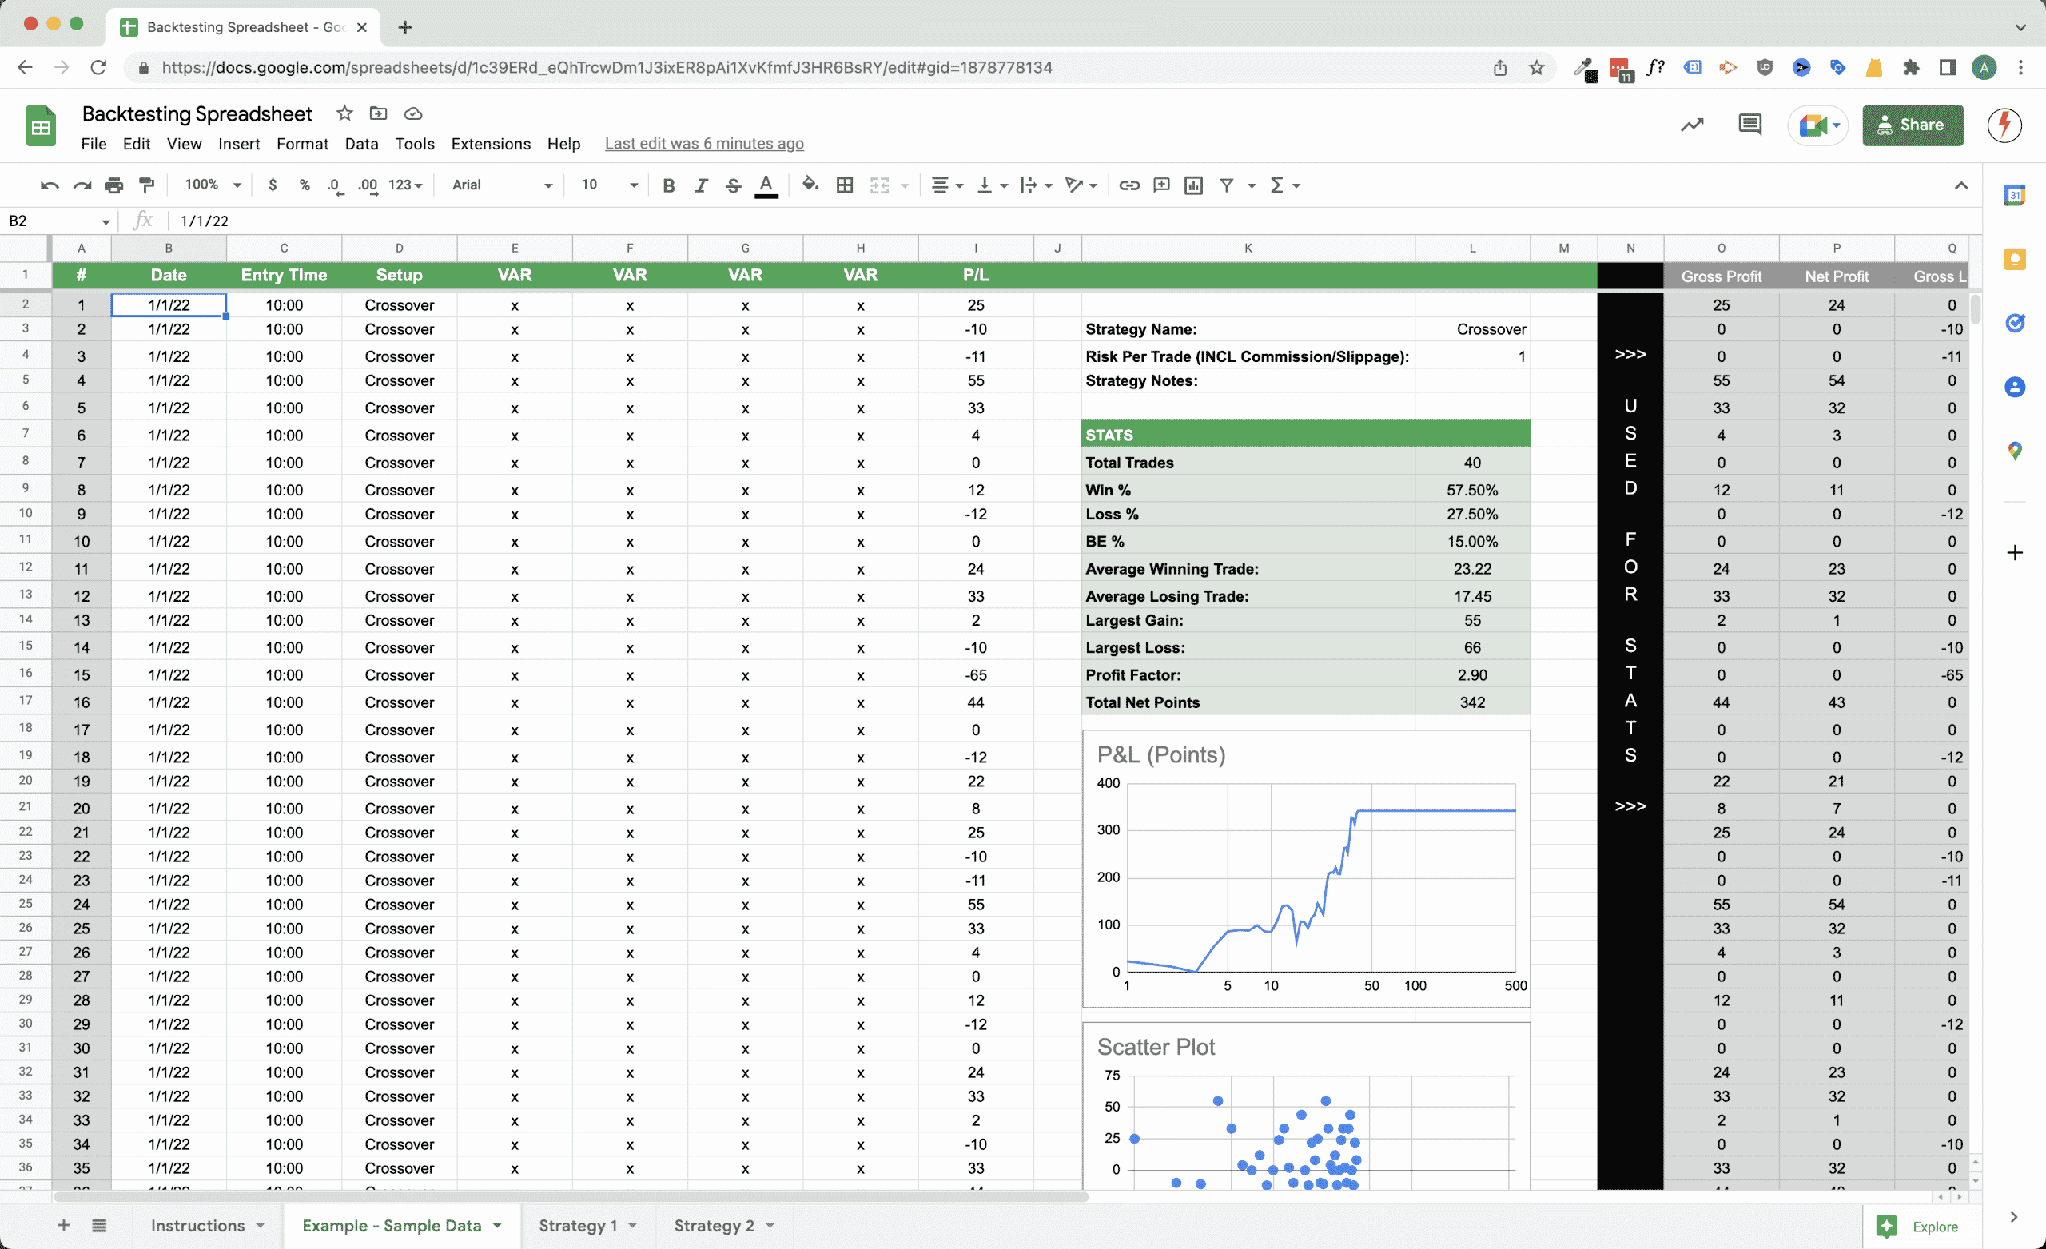
If you truly want to know how to backtest a trading strategy by hand, you need a highly disciplined sequence. Grab a blank spreadsheet. First, scroll back. Go far back in time on your chosen charting platform.
Next, hide the future. Drag the chart horizontally so the right edge is your precise starting point. You must not see what happens next. Move forward one single candle at a time. Do this strictly chronologically to simulate the passage of time.
Log everything. The precise moment your rules trigger, record the entry price, stop loss, and ultimate target. Do not selectively skip a setup just because it didn’t work and you eventually lost money. Record every single valid setup. The true art of backtesting is built on extreme, boring consistency.
Include Costs and Execution Constraints
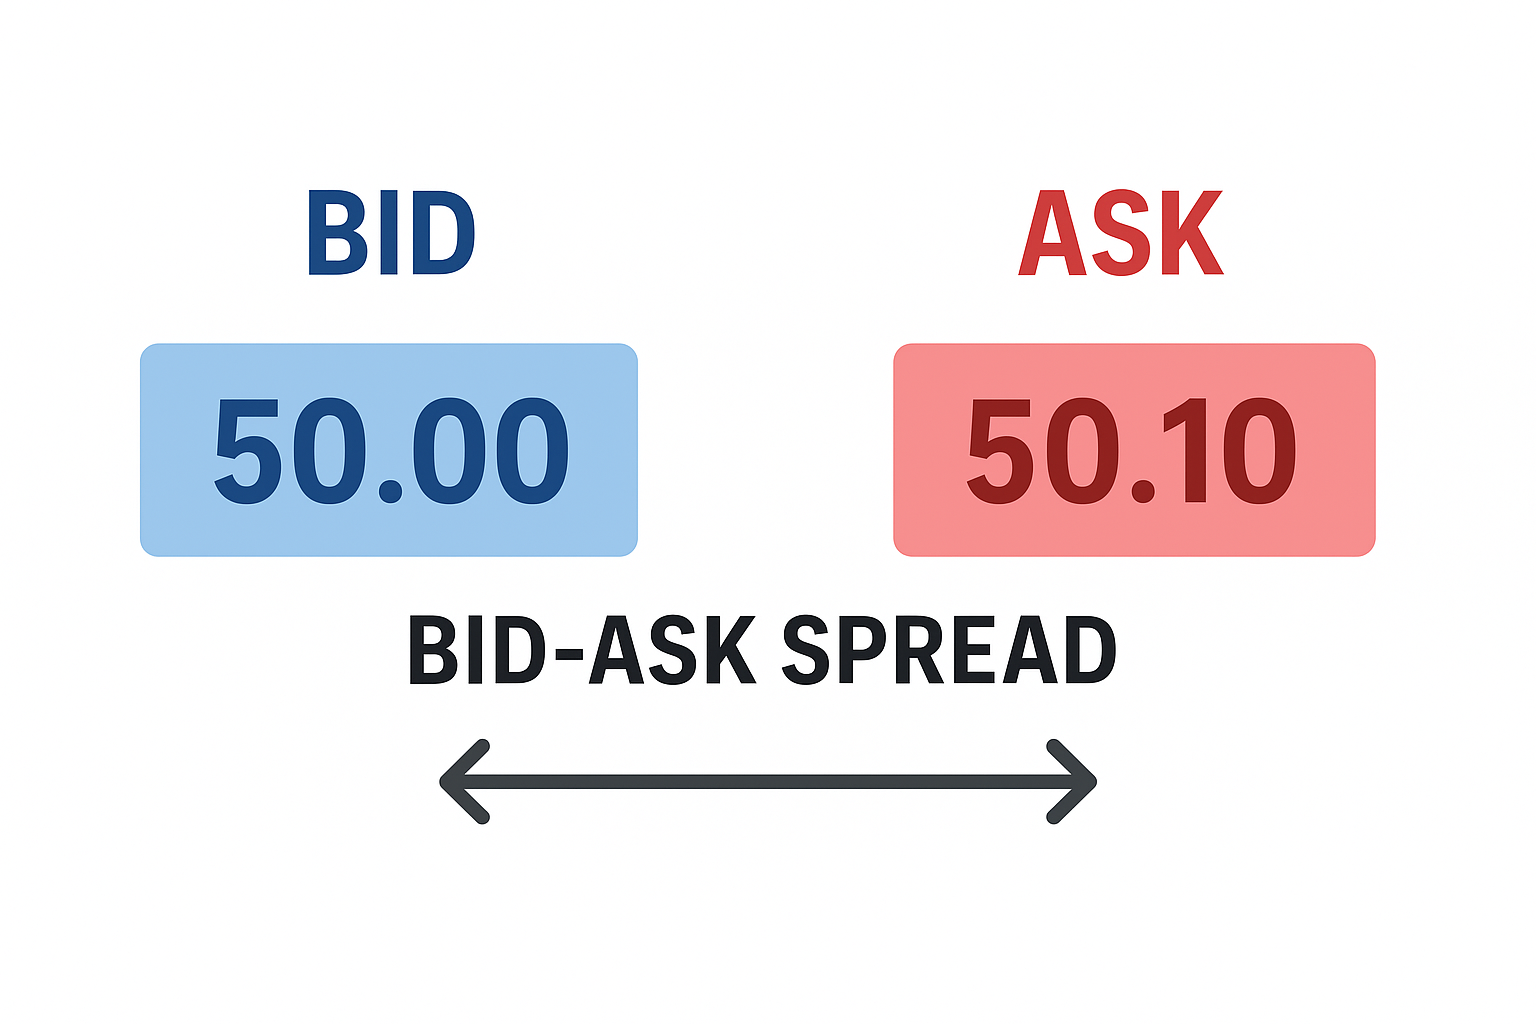
Trading costs real, hard money. You must actively model highly realistic transaction fees. This broadly includes broker commissions, the bid-ask spread, and slippage. Slippage is the annoying, inevitable difference between your expected price and your actual, filled price.
Don’t forget to calculate overnight funding rates if you heavily use margin leverage. Liquidity matters immensely, too. If you trade an illiquid, low-volume penny stock, you might only get a partial fill. Or worse, you might suffer a severely delayed execution.
Your performance metrics must meticulously account for transaction costs to be valid. A strategy that generates a 5% return before costs might actually lose you 2% after costs are applied. A gross result is entirely theoretical. The net result after fees is what actually pays the rent. Do not lie to yourself about market friction.
Metrics That Describe the Result
After the historical simulation, you need to analyze the financial carnage. You need hard, cold numbers from what you logged to evaluate the outcome properly. Here are the vital metrics you need to calculate:
- Total Number of Trades: Are we looking at 10 trades or 1,000? Small samples mean unstable estimates.
- Win Rate: The percentage of trades that ended in profit.
- Average Win and Loss: How much do you make when you are right, versus how much you lose when you are wrong?
- Expectancy: (Win Rate × Average Win) - (Loss Rate × Average Loss). This tells you what you earn, on average, per trade.
- Maximum Drawdown: The largest peak-to-trough drop in your account balance.
- Profit Factor: Gross profit divided by gross loss.
Uncertainty Behind the Headline Metrics
A win rate logically derived from 50 trades is incredibly fragile compared to one rigorously derived from 5,000. Wild outliers can heavily skew your average win. If one massive, completely lucky trade functionally accounts for 80% of your total profit, your strategy isn’t actually good.
You just got exceptionally lucky once. Consider the sequence and dependence between trades. Do your painful losses tend to clump together during certain calendar months? This inherent uncertainty means your maximum drawdown might be much deeper in the future than it ever was in the past.
Always train yourself to think in statistical ranges. A 50% win rate historically might realistically mean a 42% to 58% win rate going forward. Never treat a historical metric as a concrete, ironclad guarantee.
Biases That Make a Backtest Look Better
Our human brains desperately want to see success. This deep, psychological desire leads to wildly dangerous analytical flaws when evaluating a trading strategy. Look-ahead bias is the most common, destructive offender.
This specifically happens when you accidentally use data that wasn’t actually available at the exact time of the trade. Survivorship bias is another silent, portfolio-destroying killer.
If you aggressively test a stock strategy using only the current S&P 500 components, you are entirely ignoring all the failed companies that went bankrupt and fell out of the index during the dot-com bubble. Then there is data snooping.
If you torture the historical data long enough, it will eventually confess to anything. Tweaking your algorithmic parameters repeatedly until the equity curve looks magically smooth is the literal definition of backtest overfitting. It is a pure, unadulterated psychological illusion. You are merely building a model of past random noise.
Separate Development From Evaluation
In proper backtesting, you must strictly split your historical data. Use one specific chunk of time, widely called the training period, to develop your rules. Keep a completely separate chronological chunk locked away. This is your pristine out-of-sample period. Do not look at it.
Once your rigid rules are finalized, you run them on the out-of-sample data exactly once. This clearly simulates how the core logic will perform in the genuinely unknown future. If you peek at this final out-of-sample test, arrogantly tweak your rules, and test again, you have totally ruined the entire scientific experiment.
The out-of-sample test is your ultimate, unforgiving lie detector. Walk-forward testing takes this elegant concept much further. It continuously rolls the training and testing windows forward through time to ensure ongoing, dynamic stability.
Sensitivity: Does the Idea Survive Small Changes?
A robust trading strategy should easily survive minor, logical tweaks without completely collapsing. For example, your strategy is fragile if the profitability nosedives from 73% to 6% if you mistakenly use RSI 14 instead of RSI 13.
It strongly implies you accidentally optimized for past noise rather than discovering a true, structural market edge. Because of how messy the markets can get, if your rules require absolute, mathematical perfection to generate a dime, you will quickly lose everything when conditions naturally change.
Robustness Across Market Regimes and Assets

Great strategies are tried and tested in widely different economic conditions. Your system might look like a genius money-printer in a raging, low-volatility bull market. But how does it logically survive a high-volatility liquidity crash?
Compare deeply calm periods to absolute panic periods. If the underlying logic makes intuitive sense, try rigorously applying it to more than one eligible asset. If your momentum system works brilliantly on Apple stock, does it fundamentally also work on Microsoft?
Be extremely skeptical if a backtest only shows outsized profits during a single, highly specific historical episode. Robust backtesting requires deliberate diversity in market conditions.
Original Worked Backtest
Let’s build a transparent, simplified example together. This is purely a basic mechanics demonstration, not actual financial advice.
- The Rule: Buy the S&P 500 ETF (SPY) when it crosses definitively above its 50-day moving average. Sell when it crosses completely below.
- The Data Window: Spans from January 2018 to December 2022.
- Execution: Occurs strictly on the next day’s open immediately following the signal.
- Costs: Set at $0 commissions, but we mandate a 0.05% slippage penalty per trade.
Trade Log Summary: The simple system chopped heavily in late 2018, causing numerous frustrating small losses. It beautifully caught a massive, uninterrupted trend in 2020. It subsequently bled slowly through the choppy, painful decline of 2022.
Metrics: The overall win rate was surprisingly poor, hovering around 38%. However, the average winning trade was roughly 2.5 times the size of the average loss.
Limitations: This backtest ignores dividends and capital gains taxes. Furthermore, the outsized 2020 post-COVID rally heavily skews the total hypothetical return upward.
From Backtest to Forward Test
After surviving the historical gauntlet, you must face live data. That’s forward testing. Forward testing (often called paper trading or simulated execution) means trading your system live as the right edge of the chart unfolds, but without risking real money.
Why is this necessary? Because historical charts don’t show you the operational friction of real time. They don’t show you the server disconnecting. They don’t show you the emotional stress of watching a 4-hour candle slowly reverse against you. Run your forward testing for a predefined review period.
Say, 100 trades or three months. Track if the live metrics match the historical metrics. But be warned. Even brilliant forward tests cannot eliminate market risk. Real money brings real psychological pressure, and no simulation can perfectly replicate the moment your own hard-earned cash is on the line.
Conclusion: A Backtest Should Try to Break the Idea
The entire point of learning how to backtest a trading strategy is to become a professional skeptic of your own ideas. You aren’t trying to prove that you are right. You are actively trying to prove that you are wrong.
You do this by enforcing fixed, emotionless rules. You push the strategy with realistic trading scenarios and maintain a clean separation between development data and out-of-sample data to prevent look-ahead bias and curve-fitting. You stress-test it against different strategies to ensure robustness.
If you cannot break your strategy after throwing the worst possible historical conditions at it, you might actually have something special. Finding a weakness isn’t a failed exercise; it is the exact reason backtesting exists. It saves your capital today, so you can trade again tomorrow.
Disclaimer: The content provided in this article is for educational and informational purposes only and should not be considered financial or investment advice. Interacting with blockchain, crypto assets, and Web3 applications involves risks, including the potential loss of funds. Venga encourages readers to conduct thorough research and understand the risks before engaging with any crypto assets or blockchain technologies. For more details, please refer to our terms of service.