

Table of Contents
Support is an area where selling has previously met enough demand to slow a fall, and resistance is an area where buying has met enough supply to slow a rise. It's important to note that these are observed zones, not physical barriers or guaranteed turning points. Keep that in mind when measuring a support level or resistance level.
Why Price May React Near a Previous Level
Support level and resistance level get treated like laws of physics sometimes, but really they're a handful of plausible behavioral and mechanical explanations, not proven rules.
- Order concentration: if a lot of traders placed buy or sell orders around a certain price before (because it mattered before), those orders can still be sitting there, creating real supply or demand right at that level.
- Memory: people remember where price turned last time. If it bounced off €50 a month ago, plenty of traders are watching €50 again, and that shared attention can itself become a reason price reacts there.
- Round numbers: humans like clean numbers. Orders cluster more at €50 or €100 than at €49.73, simply because that's where people set alerts and stop orders, not because anything fundamental happens at that exact price.
- Self-reinforcing attention: if enough traders believe a level matters and act on that belief at the same time, they can make it matter, at least temporarily. The level "works" partly because people expect it to.
These are plausible mechanisms for why a level might matter, not proof that any specific level will hold on any specific chart. Whether support and resistance genuinely predict price movement, or whether it's mostly pattern-matching on noise after the fact, is often debated. This explains the reasoning behind the idea, it's not a claim about what any real market will do next.
How Support Level and Resistance Level Are Identified
There's no single official method, people spot these levels a few different ways, often using them together.
- Prior highs and lows: the most basic approach. If price hit a certain point and reversed, that point gets marked as a potential level going forward.
- Repeated reactions: one bounce could be a coincidence. A level that price has reacted to two or three separate times carries more weight, since it's held up under different market conditions each time.
- Ranges: when price bounces between a rough floor and ceiling for a while, the edges of that range naturally become the support and resistance levels people watch.
- Trendlines: connecting a series of rising lows or falling highs gives a diagonal level instead of a flat one, useful when the market's trending rather than sitting still.
- Pivot calculations: formulas that use the prior period's high, low, and close to generate likely support and resistance levels for the next period. These are mechanical and popular with short-term traders, but they're still an estimate, not a guarantee.
Treat these as zones, not exact lines. Price rarely respects a level to the penny, it'll often poke through by a bit, or reverse just before touching it.
Horizontal, Diagonal and Calculated Levels
These three approaches all aim at the same goal, spotting where price might react, but they're built on different logic, so stacking them up as if they all confirm each other can be misleading.
- Horizontal levels (prior price zones): based on the assumption that price behaves similarly at a fixed point over time, regardless of when it gets there. A zone from three months ago is treated as just as relevant today, static and time-independent.
- Diagonal levels (trendlines): based on the assumption that the rate of change matters, not just the price itself. A trendline says price should be at a certain level given how much time has passed since the trend started, that level shifts every single day.
- Calculated levels (pivot points): based on a fixed formula applied to the most recent period's high, low, and close. This assumes the immediate past session is the most relevant input, and it resets every period rather than persisting like a horizontal zone.
A horizontal zone and a pivot level lining up near the same price isn't necessarily two independent confirmations of the same thing.
A Level Depends on the Timeframe and Data Source
A level isn't a fixed fact, it's a product of the chart it came from.
- Timeframe: a daily candle's high or low can hide dozens of intraday swings that never show up once you zoom out.
- Exchange source: crypto prices differ across exchanges, so a level on one may not exist on another.
- Wicks vs. closes: a level from a brief wick spike is a different kind of evidence than one from where price actually closed.
- Chart scale: linear vs. log scaling can shift where a trendline or level visually appears to sit.
Same price action, different level, depending on which of these choices was made. Worth checking what a level is built from before treating it as fact.
Confluence and the Risk of Drawing Too Much
Confluence is when a few independent levels, a prior high, a trendline, a pivot, land near the same price. That overlap gets treated as stronger evidence.
But draw enough lines and something will always line up near wherever price reversed, after the fact. That's not confirmation, it's just odds.
What Happens When a Level Breaks
Price pushing through a level can lead a few different ways, none guaranteed.
- Breakout: a decisive move past the zone, or just a brief poke through that snaps back.
- Close beyond the zone: some wait for a candle to close past the level, not just wick through it.
- Retest: price often revisits the broken level before continuing.
- Role reversal: old resistance can become new support (or vice versa), a common pattern, not a rule.
All patterns to watch, not outcomes to expect. Breaks fail often enough to matter.
False Breaks and Liquidity Sweeps
Sometimes price pokes past a level, triggers stops sitting just beyond it, then reverses hard. Looks deliberate, but usually isn't.
- Thin liquidity: little volume needed to push price through briefly.
- Clustered stops: many traders place stops at the same obvious level, so a small push can trigger a cascade, then it runs out of steam.
- News: a headline can spike price through a level for reasons unrelated to the level itself.
Not every wick past a level is manipulation, thin markets and crowded stops can look the same.
When Support Becomes Resistance — and the Reverse
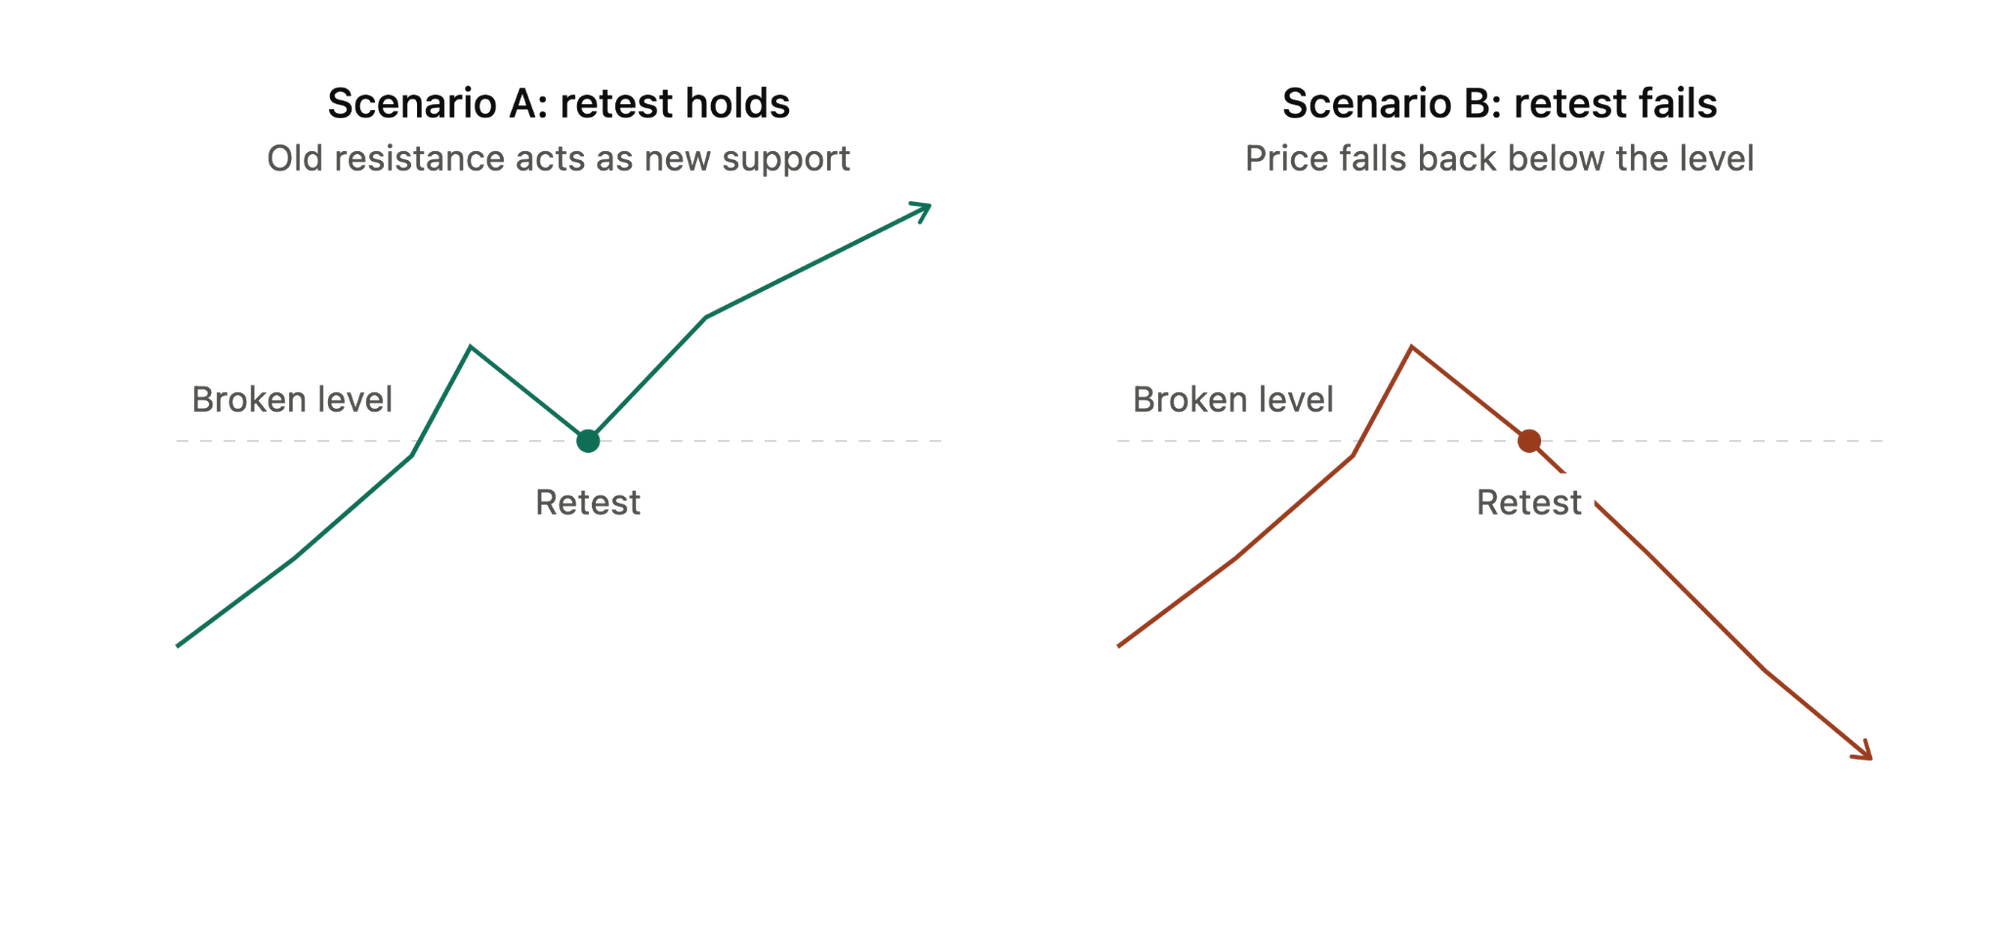
Role reversal in technical analysis is the idea that a broken resistance level can flip into support (or the reverse), and traders often watch for a retest to confirm it. But a retest isn't required, and even when it happens, it can go either way, as the two scenarios above show.
Both paths start identically: break the level, pull back to retest it. What happens next isn't determined by the pattern itself, it depends on whatever's driving price at that moment. Treat it as two possible outcomes, not a sequence price owes you.
Why a Level Can Stop Working
Levels reflect past conditions, and conditions shift.
- Repeated testing: each touch can use up the orders defending it.
- New information: news or data can make the old level irrelevant fast.
- Broad market moves: a market-wide swing can override a level tied to one asset.
- Changing participants: the traders who cared about it may be gone.
- Timeframe mismatch: a level meaningful on one timeframe may mean nothing on another.
A level reflects past behavior, but there is not a guarantee it repeats.
Original Chart Case: Drawing a Zone Without Hindsight
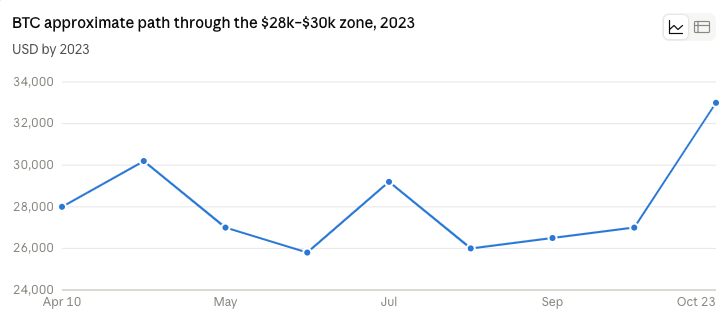
Same zone ($28k–$30k), marked the same way both times, no future knowledge used. April: cleared it in one push. Aug–Oct: rejected repeatedly for ~59 days before finally breaking. Judging a zone only after seeing which one it turned out to be is the hindsight trap.
Sources: CNBC/Yahoo Finance on the April 2023 breakout; Yahoo Finance on the Aug–Oct consolidation. Values rounded for illustration.
What Volume and Market Depth Add
A level means more if the data around it backs it up.
- Volume: a bounce or breakout on heavy participation carries more weight than the same move on thin volume, where a handful of trades could be driving it.
- Spread: a tight spread suggests active, competing interest at that price. A wide spread suggests few players actually there.
- Visible market depth: large resting orders near a level can support the idea that it matters, but depth is a snapshot, not a commitment.
Worth remembering: order-book data is venue-specific, what you see on one exchange isn't the whole market, and it can shift or vanish before your own order actually gets there.
Using Levels in a Risk Plan
Levels are more useful for planning than predicting.
- Invalidation: a level can mark the point where your original idea is just wrong, giving you a clear place to exit rather than hoping it comes back.
- Target: a nearby level can serve as a reasonable place to take profit or reassess, since price has reacted there before.
- Scenario: levels help frame "if this holds, I expect X, if it breaks, I expect Y" rather than a single fixed prediction.
Placing an order exactly on a visible line puts it right where everyone else is watching too. That's often the noisiest spot on the chart, prone to brief wicks and poor fills. Many traders leave a buffer around the level rather than sitting right on it.
Limits of Support and Resistance
A level isn't fair value, just a price where reactions happened before. It isn't probability either, five past touches don't set the odds for a sixth. And it isn't maximum loss, that's your decision, not the chart's.
It's also subjective. Two people can draw different lines on the same chart, both defensible. And it's easy to keep redrawing until a line matches whatever already happened. At that point it's not analysis, it's essentially hindsight. The past doesn't equal the future. Similar to how a fortune teller can't actually tell you your future just from learning about your past.

Conclusion: Treat Levels as Areas of Interest
Reactions happen for real reasons, clustered orders, shared attention, round numbers. Breaks happen for real reasons too, exhausted liquidity, new information, a market-wide move. Both are normal. So treat a level as a zone worth watching, not a wall that has to hold or a line that predicts anything. Use it alongside context, decide your risk before price gets there, and judge it on evidence gathered in the moment, not on how good it looks after the fact.
Disclaimer: The content provided in this article is for educational and informational purposes only and should not be considered financial or investment advice. Interacting with blockchain, crypto assets, and Web3 applications involves risks, including the potential loss of funds. Venga encourages readers to conduct thorough research and understand the risks before engaging with any crypto assets or blockchain technologies. For more details, please refer to our terms of service.