
Table of Contents
Contrary to the story sold on social media, a single profit does not prove a great strategy and a single loss doesn't prove you have a bad one. This is why professional traders spend time reviewing every single trade they place.
A highly useful trade review records your execution and your strict rule adherence immediately after each trade, while genuine performance conclusions require a vast series of comparable trades. In this review, we'll go through the key metrics to add to your journal on your journey to becoming a sustainably profitable trader.
Data to Capture for Every Trade

If you want to get better and more profitable in trading, you need a meticulous trading journal. But what exactly should go into it? First, stick to the facts, keeping in mind that every piece of information is important.
You need to record the instrument traded and the direction (long or short). Log your exact entry and exit times. Track your position size. Note your planned risk versus your actual fills. Don't forget to include those pesky fees.
Keep your subjective notes entirely separate from your numeric fields. The numbers you record can be calculated and charted, while the emotions in your subjective notes cannot.
If your trading journal mixes, I felt anxious and bought at $150, filtering your data later becomes a nightmare. Lastly, after closing every position, tag the setup. Record the specific reason for your exit. Was it a target hit, a stop out, or a time-based exit? Note it down.
R-Multiple and Planned Risk
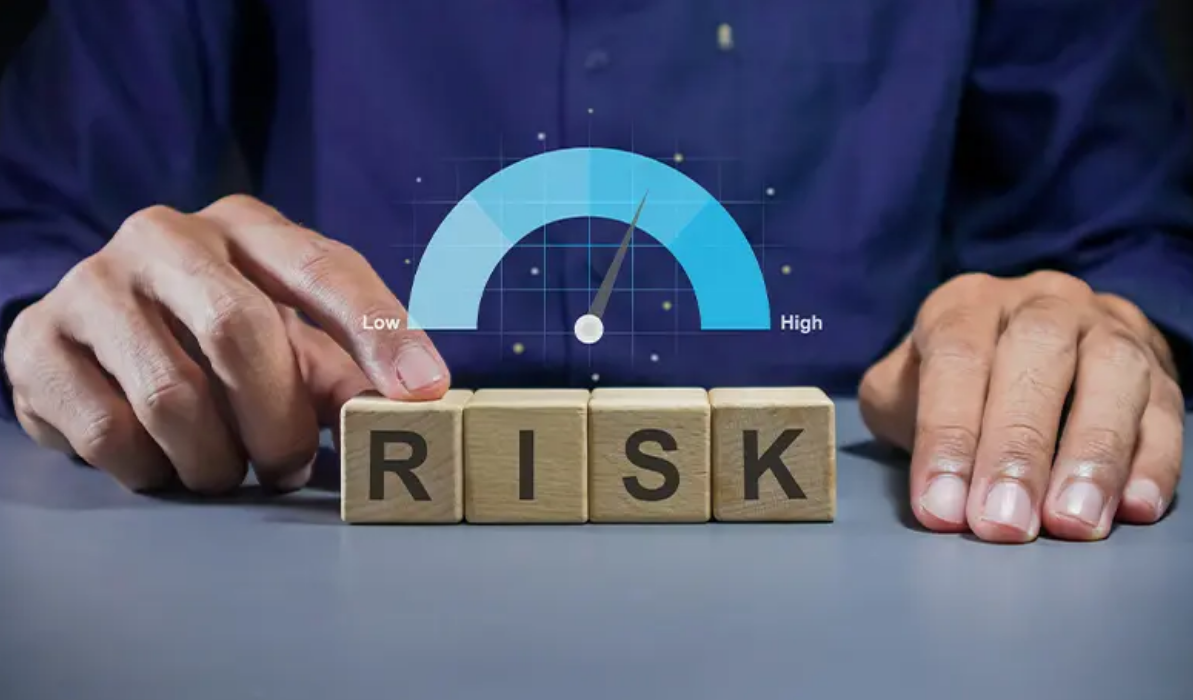
In your trading journal, 'R' will appear very often. 'R' simply stands for your planned amount at risk. If you plan to risk $100 on a trade, 1R is $100. Every single result should be expressed relative to this number.
If you made $300 on that trade, that's a +3R trade. If you lost $50, that's -0.5R. This normalizes your data, making a solid trade review possible regardless of changing account sizes. It also gives you a realistic look at your risk-reward ratio.
But here's the catch. Slippage and discretionary exits can totally wreck your planned 'R'. You might plan a 1R loss, but terrible execution during breaking news turns it into a -1.5R disaster. Tracking the difference between planned risk and realized risk is critical.
Process Metrics Before Outcome Metrics
Before you begin obsessing over the dollar signs, take a hard look at your actual execution. Did you even follow your own meticulously crafted rules? Trading rules are not going to give you the desired results if you don't follow them.
It's vital for you to process your adherence extensively, which covers your entry, your sizing, and your exit protocols. It also demands an answer to a critical question: did the trade organically match the intended market condition?
While some traders use quality scores ranging from 1 to 10, we believe scores that most amateurs use. Instead, force a simple yes, no, or partial scale. Did you follow the precise plan? Yes. Did you recklessly oversize? No. This keeps your trade review brutally, refreshingly honest.
Execution and Cost Metrics
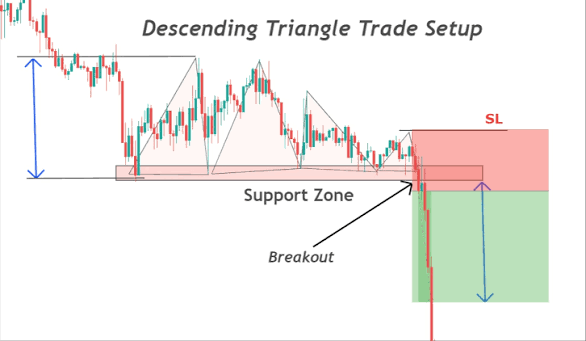
Every trading rule is just as good as the quality of the execution. In your trading journal, you must calculate your entry and exit slippage. How far away from your intended price did you actually get filled?
Just as importantly, calculate the total fees you spent on the trade. While they may look negligible, especially when displayed as 0.1% maker/take, they can add up much faster than you think. So, tally up your total fees, commissions, spreads, and funding rates.
State the specific benchmark you use for your expected price. Is it the bid/ask midpoint at the time of your signal? Finally, log your total holding time. Time is money, and holding a position ties up your capital.
Maximum Adverse and Favourable Excursion
Maximum Adverse Excursion (MAE) and Maximum Favourable Excursion (MFE) strictly measure the extremes of a position.MAE is the absolute largest price move against your position while it remained open.
Conversely, MFE is the absolute largest move in favour of it. They brilliantly tell you how much heat you absorbed, and exactly how much loose change you left on the table.
These vital trading metrics actively inform your exit review without relying on toxic hindsight bias. You cannot legitimately rewrite your original decision with future path information, but you can certainly learn if your stop-losses are consistently choked too tight.
Performance Metrics for a Series of Trades
Looking at a single trade review is like staring at a single pixel and trying to guess the entire movie. It's impossible. You absolutely need a series. A proper sample size transforms raw, chaotic noise into actionable trading metrics.
This happens because variance is a notoriously cruel master. Judging your shiny new system on three consecutive wins feels fantastic. It is also completely scientifically bankrupt.
You need to define a mathematically sufficient group of trades before you even glance at these heavier numbers. While ideally you need at least 100 trades, you can begin with 30-50 trades. Once you cross that statistical threshold, the real truth of your performance finally emerges.
Holding Time, Exposure and Capital Use
Time is capital. Literally. Many amateur traders obsess over pure returns while entirely ignoring the brutal cost of time. You must relentlessly track your average holding period, your total time exposed to live market heat, and the actual cash committed.
Two wildly different strategies can easily boast identical 20% annual returns. But let me tell you, their underlying mechanics will demand totally different psychological endurance.
If Strategy A violently ties up your entire portfolio for agonizing weeks, and Strategy B seamlessly gets in and out in smooth minutes, they are fundamentally entirely different beasts. One drains your liquidity; the other frees it up.
From the table, we can see that Strategy A leaves you totally exposed to sudden overnight news bombs while Strategy B lets you sleep like a baby. Same return. Wildly different trading metrics.
Win Rate and Average Win or Loss
Your win rate is a great showoff number, but it rarely tells the whole story. It is an incredibly incomplete, frankly dangerous vanity metric that feeds your ego but starves your account.
Winning a glorious 80% of the time means absolutely nothing if your bloated losers constantly wipe out your tiny winners. You have to fiercely examine the relationship between your strike frequency and your eventual payoff size.
While your ego would force you to have a high win rate, the math of the market does not care. A highly professional trader might only win 35% of the time. However, their unique combination of a modest win rate, alongside a massive average win versus a tiny average loss, is where the genuine edge actually lives.
Expectancy
Trading expectancy is the metric that will pump life into your strategy. If this number is negative, you are slowly bleeding out. If it is positive, you have a legitimate profitable trader. The formula is:
(Win Probability × Average Win) - (Loss Probability × Average Loss)
Let's use a simple example where Trader A has a 40% win rate. While many traders on social media will consider this rate low, he has an average win of $300. Trader A may lose 60% of all his trades, but he caps his average loss at $100.
(0.40 × $300) - (0.60 × $100) = $120 - $60 = $60.
It means that he has a trading expectancy of a positive $60 per trade. This $60 profit applies to both winning and losing traders. Over a large series of trades, this will certainly add up. But remember, always label this calculated result for exactly what it is: a purely historical sample estimate, absolutely not a magical crystal ball reliably forecasting the future.
Profit Factor
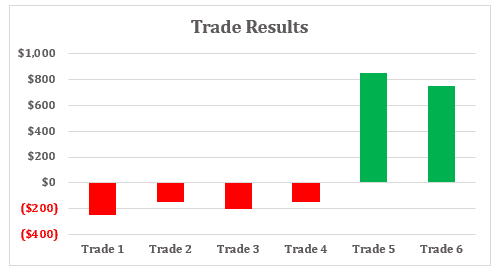
If you want to check whether your strategy is sustainably profitable, then you must rigorously check the profit factor. It strips away all the complicated noise. It is quite simply your gross profits cleanly divided by your gross losses.
If your trading journal shows you made $12,000 in total winning trades this quarter, and lost $8,000 in total losing trades, your profit factor is exactly 1.5. A profit factor resting barely above 1.0 is technically deemed profitable. However, it is also too close for comfort.
Most highly robust systems aim significantly higher than 1.5 to safely absorb inevitable market shocks and savage execution slippage. When calculating this, keep a hyper-vigilant watch out for wild outlier trades. One lucky $10,000 lottery-ticket win can massively skew your profit factor and feed you deeply false confidence.
Drawdown and Losing Streaks
While most traders brag about their win rate, losing tests the resolve of a trader more than anything else. Your maximum drawdown is the peak-to-trough decline of your trading account. It tells you exactly how much pain you endured before recovering to new highs.
You hit an all-time high of $50,000. Then, the market violently turns against your edge. A string of losses drags your account down to $40,000. That brutal 20% drop is your maximum drawdown for the period.
Sequence matters immensely here. Even if your trading expectancy is highly positive, a severe losing streak can trigger a crippling maximum drawdown. Avoid looking for a single acceptable threshold that applies to every single trader.
Because your strategy and approach are different, a 15% maximum drawdown might be acceptable for an aggressive crypto strategy but completely unacceptable for a conservative retirement portfolio.
Recovery Time and Sequence Risk
How long did your account sit deep in the red zone below its previous peak? That, my friend, is your true recovery time. This metric is heavily tied to your psychological capital.
If your maximum drawdown lasts for 18 months, do you have the discipline to keep trading the system? This highlights sequence risk. The exact same trades, shuffled in a different order, can result in wildly different trading experiences.
If you get hit with ten losses in a row right out of the gate, you might abandon a perfectly good strategy. Again, keep this metric historical. It tells you what happened, not what will happen next.
Original Example: Five Trades Are Not a Conclusion
Let's build a small trading journal log to prove an essential point. Imagine you execute five textbook trades.
After five trades, you have 3 wins and 2 losses. Your risk-reward ratio looks great. Your profit factor is heavily skewed positive. Now, imagine Trade 6 is a massive gap-down where slippage results in a -4R loss.
Suddenly, your profit factor plummets. Your trading expectancy turns negative. This is exactly why five trades are completely useless for making concrete conclusions. The sample is simply too unstable. You need 30, 50, or even 100 trades to smooth out the noise.
Segment Results to Find Useful Patterns
If you follow your trading rules dutifully and journal them, over time, you'll get to a point where you have enough data. When that time comes, you need to divide your results and compare them by setup to help you find where your edge in the market is.
Compare your historical outcomes by specific setup type, asset class, precise timeframe, trading session, or broader market regime. You might shockingly find you're a certified genius at trading morning tech equities, but utterly terrible at grinding afternoon forex markets.
A stark word of warning: slicing your precious data too intimately thin creates completely false patterns. Always aggressively enforce a strict minimum sample rule before recklessly tweaking your strategy based on a hyper-filtered result.
Tagging Rules and Data Quality
Your dedicated trade review is strictly only as good as your underlying data quality. Painstakingly define your custom tags before you even start analyzing the spreadsheets.
Keep your chosen category names strictly, unwaveringly stable. If you formally call it a breakout on a sunny Monday, don't suddenly call it a momentum shift on a rainy Thursday. Be absolutely sure to honestly record missing values, too.
Most importantly, deeply avoid the siren song of hindsight tagging. Actively changing labels right after seeing the painful result violently creates imaginary patterns that were never, ever genuinely present in the heat of the moment.
A Review Rhythm That Separates Learning From Noise Distinguish
While the market can be fast-paced and force traders to make quick decisions, you need to develop a rhythm. Clearly distinguish between your immediate after-trade data capture, your deeper weekly process review, and your highly periodic strategy evaluation.
Capture the raw, unfiltered data immediately while it's still fresh in your mind. Review your strict adherence to the process at the quiet end of the trading week. Only evaluate the important factors, actual strategy metrics like your long-term risk-reward ratio and rolling maximum drawdown.
You can evaluate quarterly or after a substantially large block of trades. Another very important note is to avoid mentally changing your core rules right after every single outcome. If you do, you'll add more noise than you need to your data.
Conclusion: Measure Decisions and Results Separately
Your daily trade review should focus strictly on the small things that matter. After every trade, ask yourself Did I follow the rules? Did I execute cleanly? These will make up your decision metrics.
On the other hand, your longer-term trading metrics, including your average win, average loss, and profit factor, belong to a series of trades. These are your outcome metrics. They are both important metrics, but shouldn't be confused.
The ultimate purpose of a trading journal isn't to guarantee improvement. It is to provide crystal clear, undeniable evidence for review. It separates the stories you tell yourself from the reality of the market. And in trading, reality is the only thing that pays.
Disclaimer: The content provided in this article is for educational and informational purposes only and should not be considered financial or investment advice. Interacting with blockchain, crypto assets, and Web3 applications involves risks, including the potential loss of funds. Venga encourages readers to conduct thorough research and understand the risks before engaging with any crypto assets or blockchain technologies. For more details, please refer to our terms of service.