

Table of Contents
Moving averages are one of the core indicators in technical analysis, and there are different versions. SMA is the easiest moving average to construct. A moving average smooths past prices to make direction easier to see, but it reacts after the underlying data and cannot predict a reversal. SMA and EMA are different weighting methods.
A simple moving average (SMA) is calculated by adding all the data for a specific time period and dividing the total by the number of days. An exponential moving average (EMA), which is also known as a weighted moving average, assigns greater weight to the most recent data. This is sort of similar to weighing yourself on a scale. You pay more attention to what the most recent weight reading is than to what you weighed one month ago.
How a Simple Moving Average Is Calculated
A simple moving average is calculated by adding a set of prices together and dividing the total by the number of periods.
Prices for 7 days
- Day 1: $10
- Day 2: $12
- Day 3: $14
- Day 4: $16
- Day 5: $18
- Day 6: $20
- Day 7: $22
Five-period calculation
- First Value (Day 5): Add the prices from Day 1 to Day 5 ($10 + $12 + $14 + $16 + $18 = $70). $70/5 = $14
- Second Value (Day 6): Move the window forward by one day. Drop Day 1 ($10) and add Day 6 ($20). The new total is $80 ($12 + $14 + $16 + $18 + $20). $80/5=$16
- Third Value (Day 7): Move the window forward again. Drop Day 2 ($12) and add Day 7 ($22). The new total is $90 ($14 + $16 + $18 + $20 + $22). $90/5=$18
Analysts use the closing price or the last trading price of each day. A five period average needs five data points or more to work. That's why the first value needs enough observations.
How an Exponential Moving Average Differs
In an exponential moving average, higher importance is given to newer data. In other words, recent observations receive more weight. Also the line usually responds faster, although this does not automatically make it more accurate. In a 10-day EMA, the most recent data point would count as 18.2% of the total calculation, but the oldest would count as only 3%.
This is how to calculate the multiplier for the 10-day EMA: {2 / (time periods + 1) } = {2 / (10 + 1) } = 0.1818 (18.18%)
Which Price and Data Source Feed the Average
A moving average is calculated using specific price types and data sources fed into an algorithm. Open price is the first transaction price recorded at the beginning of a time candle. Close price is the last transaction price recorded at the beginning of a time candle. Typical price is the average of the candle's high, low, and close prices. Finally, venue-specific data are price feeds pulled from a marketplace, like Binance for example. Each of these are possible inputs. Two platforms can display slightly different averages when their candles, timezones or price feeds differ.
Period Length and Chart Timeframe
Here is a table showing short vs. long period.
20 hourly candles = 20 hours of price action ≈ roughly 3 trading days (depending on market hours). This is a very short-term view
20 daily candles = 20 trading days ≈ about one calendar month. This is a medium-term view.
The right choice for period length depends on how long you intend to hold a position. There isn't a universal rule for the period length you choose.
Why 20, 50 and 200 Periods Are Common
For moving averages on a daily chart the 50 and 200 periods are common because they map roughly to quarterly and near yearly views and the 20 period is common because it maps to about one calendar month. These settings are market conventions, not natural laws. When you switch to an hourly chart the periods track day and weekly cycles. 20 is nearly a day, 50 is nearly a week of trading data (for the stock market) and 200 is about a month of hourly price action.
What Traders Look For
Traders look for a variety of things when they are reading charts. The main interpretations are observations.
Price Above or Below the Average
Price above the moving average indicates bullish momentum and often indicates that an uptrend is starting or continuing. Price below the moving average indicates bearish momentum and often indicates a downtrend. When the market is in a range, the price will cross above and below the moving average line repeatedly. This can happen due to the average flattening out or a lack of momentum. Also, in a range, traders buy at the bottom and sell at the top. Because the moving average is in the middle, every swing forces the price to cut through the average. Finally, false breakouts, also known as Whipsaws, happen when a minor push above or below the average runs out of energy, causing the price to reverse and cross back over.
Slope and Change in Direction
A rising average summarizes an upward trend. A falling average summarizes a downward trend. A flat average summarizes stability or a lack of momentum. A moving average reacts uniquely to a massive spike or drop because of its structure. When a significant change happens in the data, it will not be reflected in the average immediately. However, single extreme observations can distort the moving average.
Moving Average Crossovers
A moving average crossover uses the intersection of two moving averages to identify changes in the market or momentum. A short versus long crossover happens when a short-term moving average intersects with a long-term moving average on a price chart. Because they are based on past data, they do not have predictive power. Because they rely on historical averages, the signals can arrive late.
Moving Averages as Dynamic Support or Resistance
Traders treat moving averages as dynamic support or resistance because price levels change with every new bar. Price reacts near moving averages for a few reasons. Millions of traders and funds watch the 50 or 200 day moving averages. When the price gets close to these lines, a lot of buy or sell orders are triggered at the same time. Second, prices tend to overextend and then pull back toward their average value. Finally, large institutions often accumulate or liquidate large positions near these lines of long-term moving averages. Moving averages fail often. When market sentiment changes, the price will slice right through an average.
Worked Chart Example: Trend and Range
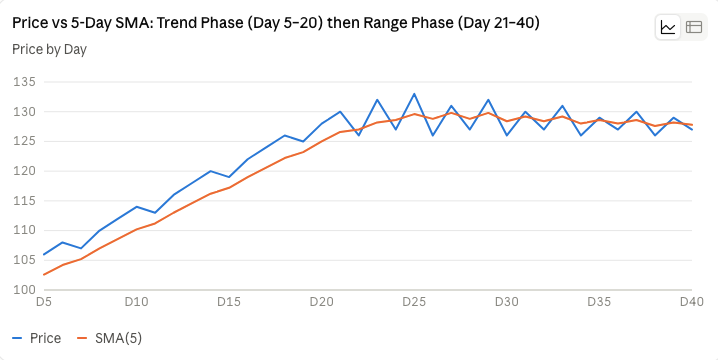
Days 5–20: Trend phase. Price stays above the SMA for the entire period, and the SMA itself is steadily rising
Days 21–40: Range phase. Price oscillates roughly between $126 and $133 with no net direction, and the SMA flattens out around $128–130 — sitting right in the middle of the oscillation.
Combining an Average With Volume or Volatility
To clarify whether a market move has true participation or an unusually wide range, you can combine a standard moving average with either Volume or Volatility. Volume and volatility introduce entirely new data points instead of recycling the same price history. Here is how to use one additional input to filter your moving average.1. Combining with Volume (To Measure Participation)
Standard moving averages only look at closing prices. Adding volume reveals if large institutional traders are backing the price move.
Combining with Volatility (To Measure Range Width)
Volatility tells you if a price move is market noise or a large expansion in range.
Testing a Moving-Average Rule
Testing a Moving-Average (MA) crossover rule requires a framework to make sure the strategy is accurate before deploying capital. It's sort of like testing whether the chocolate milkshake you made tastes good before offering it to your friend.
- The Crossover: Select a fast MA (e.g., 50-day) and a slow MA (e.g., 200-day). A bullish crossover (Golden Cross) occurs when the fast MA crosses above the slow MA. A bearish crossover (Death Cross) occurs when the fast MA crosses below the slow MA.
- Entry Timing: Define exactly when to execute the trade after a crossover occurs. The usual approach is to enter at the market open of the next trading session following the day the crossover closes.
- Exit Strategy: Establish rules to close the position. The primary exit is the reverse crossover (e.g., exiting a long position when a bearish crossover occurs). Also, use a fixed percentage stop-loss to limit the downside risk.
- Transaction Costs: Account for execution issues to make sure of realistic results. Deduct a fixed amount per trade for brokerage commissions and factor in slippage (the difference between the expected price and the actual execution price).
- The Sample: Select a specific asset class (e.g., S&P 500 ETF) and a defined historical timeframe (e.g., 2010–2020). Ensure the sample includes various market aspects, like prolonged bull markets, high-volatility corrections, and sideways trends.
- False Signals (Whipsaws): In sideways or range-bound markets, the fast and slow MAs will repeatedly cross each other. This generates multiple false buy and sell signals.
- Parameter Sensitivity: A strong strategy should produce similar results if parameters are shifted slightly.
- Out-of-Sample Testing: To validate that the rule has predictive power, split the data. Optimize the MA lengths on an in-sample dataset (e.g., 2010–2018), and then test the finalized parameters on an untouched out-of-sample dataset (e.g., 2019–2026) to see how it performs on previously unseen market data.
What Moving Averages Do Not Show
Moving averages do not show asset valuation, fundamental company quality, liquidity levels, upcoming news risk, future volatility, or execution price. Because they are metrics derived from past price data, they smooth out historical fluctuations instead of forecasting future realities. Using multiple moving averages for confirmation is like asking three people the exact same question when the second and third people are just waiting a few seconds to repeat what the first person said.
Simple Moving Average Vs. Exponential Moving Average Comparison
Here is a table comparing SMA and EMA according to different aspects.
Conclusion: A Smoother View, With a Delay
Moving averages provide valuable context by smoothing out market noise and highlighting the underlying trend. But their effectiveness depends on your settings (like time frame) and the current market regime (trending versus ranging). To ensure profitability, always test your moving average rules by factoring in transaction costs and strict risk limits.
Disclaimer: The content provided in this article is for educational and informational purposes only and should not be considered financial or investment advice. Interacting with blockchain, crypto assets, and Web3 applications involves risks, including the potential loss of funds. Venga encourages readers to conduct thorough research and understand the risks before engaging with any crypto assets or blockchain technologies. For more details, please refer to our terms of service.