
Table of Contents
Technical indicators are calculations based on price, volume or related market data. Technical indicators organise past information and may support a process, but do not know the future or remove the need for risk controls.
Start With the Question, Not the Indicator
Adding an indicator to a chart without a defined question creates market noise. Because most technical indicators use the same price and volume inputs, layering them blindly causes redundant indicators to give a false sense of security or conflicting signals (analysis paralysis).
To eliminate noise, choose one tool to answer each of the four core market questions:
- Direction (Which way is it going?): Identifies the trend. Trading against it reduces your win rate.
- Momentum (How fast is it moving?): Measures the speed of the move. Tells you if a trend is gaining strength or losing steam.
- Volatility (How far can it move?): Measures price swings. Defines how wide your stop-losses and targets must be.
- Participation (Are others supporting this?): Uses volume to confirm if a price move is real or a false breakout.
The General Rule: One indicator per question. If a tool doesn't answer one of these four questions on your chart, delete it.
A Beginner-Friendly Set of Indicator Types
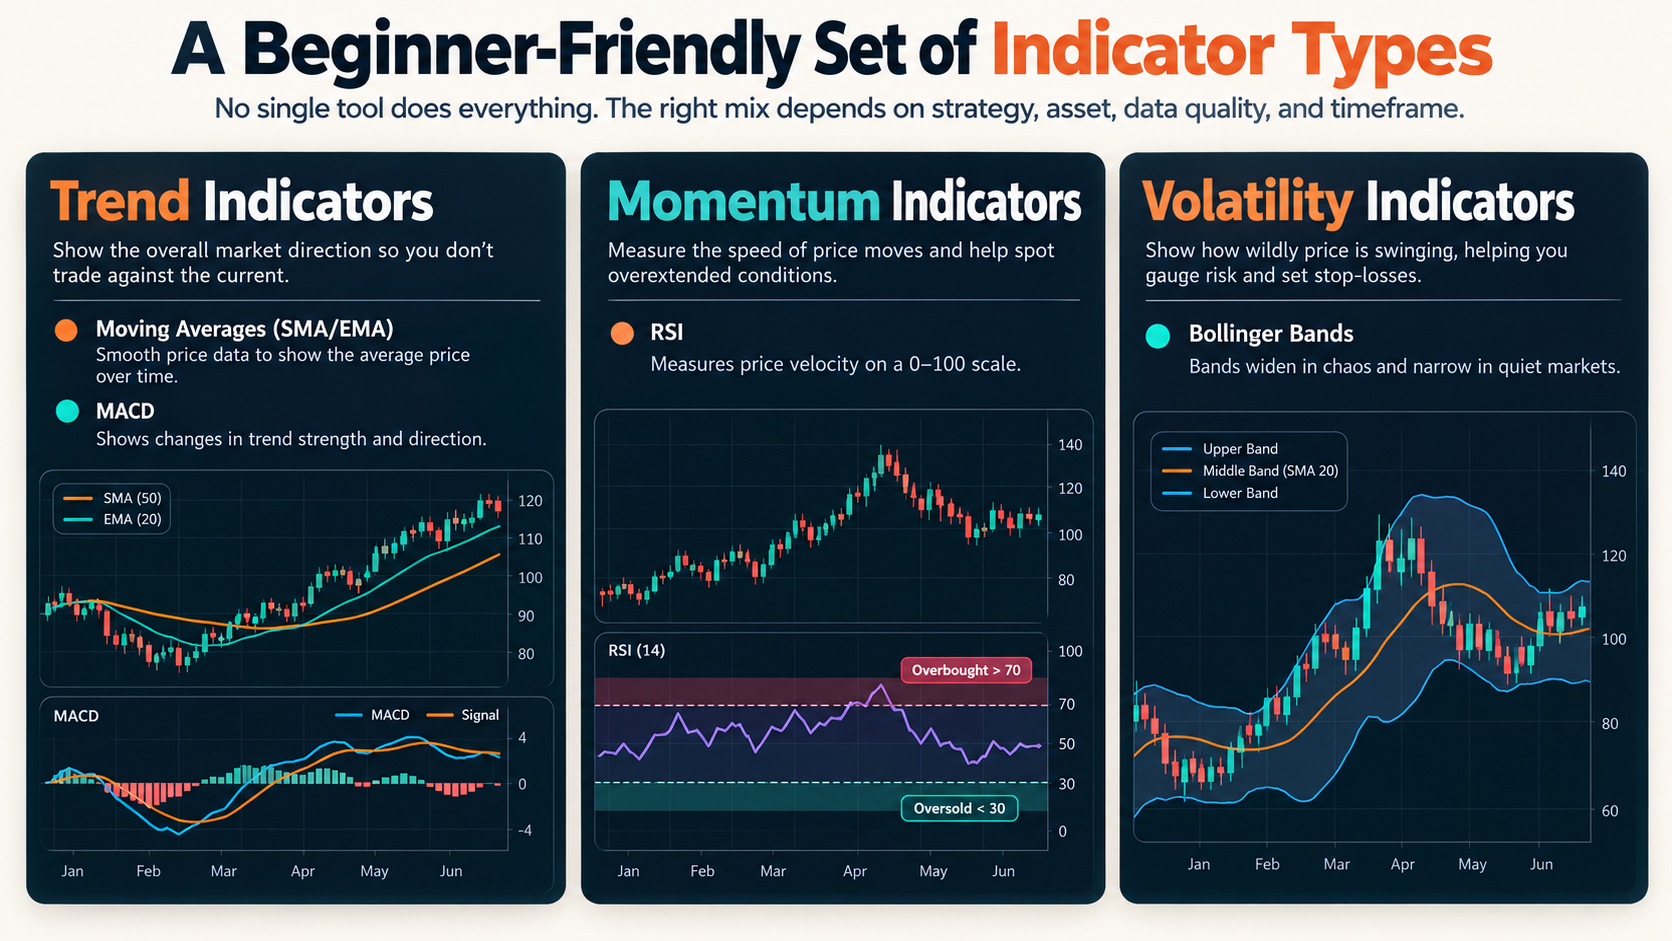
Here is a streamlined, beginner-friendly toolkit of technical indicators. No single tool does everything. The right mix depends entirely on your specific trading strategy, the asset you are trading, data quality, and your chosen timeframe.
Trend Indicators
These help you determine which way the market is moving overall so you don't trade against the current.
- Moving Averages (SMA/EMA): Smooths out price data to show the average price over a set period.
- Moving Average Convergence Divergence (MACD): Tracks the relationship between two moving averages to show changes in trend strength and direction.
Momentum Indicators
These measure the speed of price movements to help you spot when an asset might be overextended.
- Relative Strength Index (RSI): Measures price velocity on a scale of 0 to 100. It signals potential "overbought" conditions (above 70) or "oversold" conditions (below 30).
Volatility Indicators
These show how wildly the price is swinging, helping you gauge risk and set stop-losses.
- Bollinger Bands: A bands-style overlay that expands when the market is chaotic and shrinks when the market is quiet.
Settings, Defaults and the Meaning of a Period
In technical analysis, a period simply represents one individual bar or candlestick on your chart.
This means settings like a 14-period RSI or a 20-period Moving Average don't have a fixed real-world duration. Instead, their timeframes adapt completely to your chart's interval:
- On a 5-minute chart, a 20-period indicator looks at the last 100 minutes (20 bars × 5 minutes).
- On a daily chart, that exact same 20-period indicator looks at the last 20 days (20 bars × 1 day).
Changing the lookback period
Adjusting this lookback setting directly alters how sensitive the indicator is to price movements:
By shortening the period, you make the indicator react aggressively to recent price changes. By lengthening it, you smooth out the noise to focus on the bigger picture.
Moving Average for Trend Context
A Moving Average (MA) is a foundational technical indicator used to identify the overall direction of a market trend.
Here is how it handles data smoothing, period lengths, and lag:
- What it smooths: It filters out short-term price fluctuations and random market "noise." By averaging out price points over a set timeframe, it reveals the cleaner, underlying trend line beneath volatile daily ups and downs.
- The effect of period length: The number of days or bars you choose completely changes its behavior.
- Short-term periods (like a 10-day Moving Average (MA)) track the current price closely and react fast, but they show more noise.
- Long-term periods (like a 200-day Moving Average) provide a much cleaner view of the major trend but won't react to sudden, critical market shifts until much later.
- The unavoidable lag: Because moving averages are calculated using historical price data, they look backward, not forward. They tell you what the market has done, meaning a trend is already well underway by the time the indicator reflects the change.
RSI for Momentum Context
The Relative Strength Index (RSI) tracks price momentum on a strict 0–100 scale.
The Scale and Zones
- 70+ (Overbought): Momentum is heavily skewed upward.
- 30- (Oversold): Momentum is heavily skewed downward.
The Reversal Trap
The biggest trap is assuming "overbought" means "sell" and "oversold" means "buy."
- Trends stay extended: In a strong bull market, RSI can stay above 70 for weeks while prices keep climbing. Shorting blindly is highly risky.
- It shows strength, not just exhaustion: A high RSI simply confirms powerful buying pressure.
- Wait for confirmation: Don't try to guess the exact peak. Wait for the RSI line to actually cross back inside the boundaries (like falling below 70) before acting.
Volume for Participation
Volume validates a price move by showing the level of market commitment behind it. High volume during a breakout signals strong buyer or seller participation, confirming the trend. Low volume suggests a lack of conviction, often warning of a false breakout.
However, crypto lacks a centralized tape, making volume data messy:
- Fragmented Liquidity: Trading is split across dozens of different CEXs and DEXs.
- Inconsistent Data: Exchanges use different timezones, reporting metrics, and API speeds.
- Distorted Signals: Wash trading and off-chain moves skew the true numbers.
To counter this, traders rely on aggregated volume feeds or focus only on the top-tier exchanges for a cleaner signal.
Bollinger Bands or ATR for Volatility
Bollinger Bands and Average True Range (ATR) are two of the most popular tools for measuring market volatility, but they approach the data quite differently. This is similar to how Futbol and Basketball are both popular sports, but they are quite different.
Crucially, neither indicator predicts market direction because they only look at how much a price is moving, not where it is going. They measure the size of price swings, but a massive price swing can happen just as easily to the upside as it can to the downside.
The Main Choice: Bollinger Bands
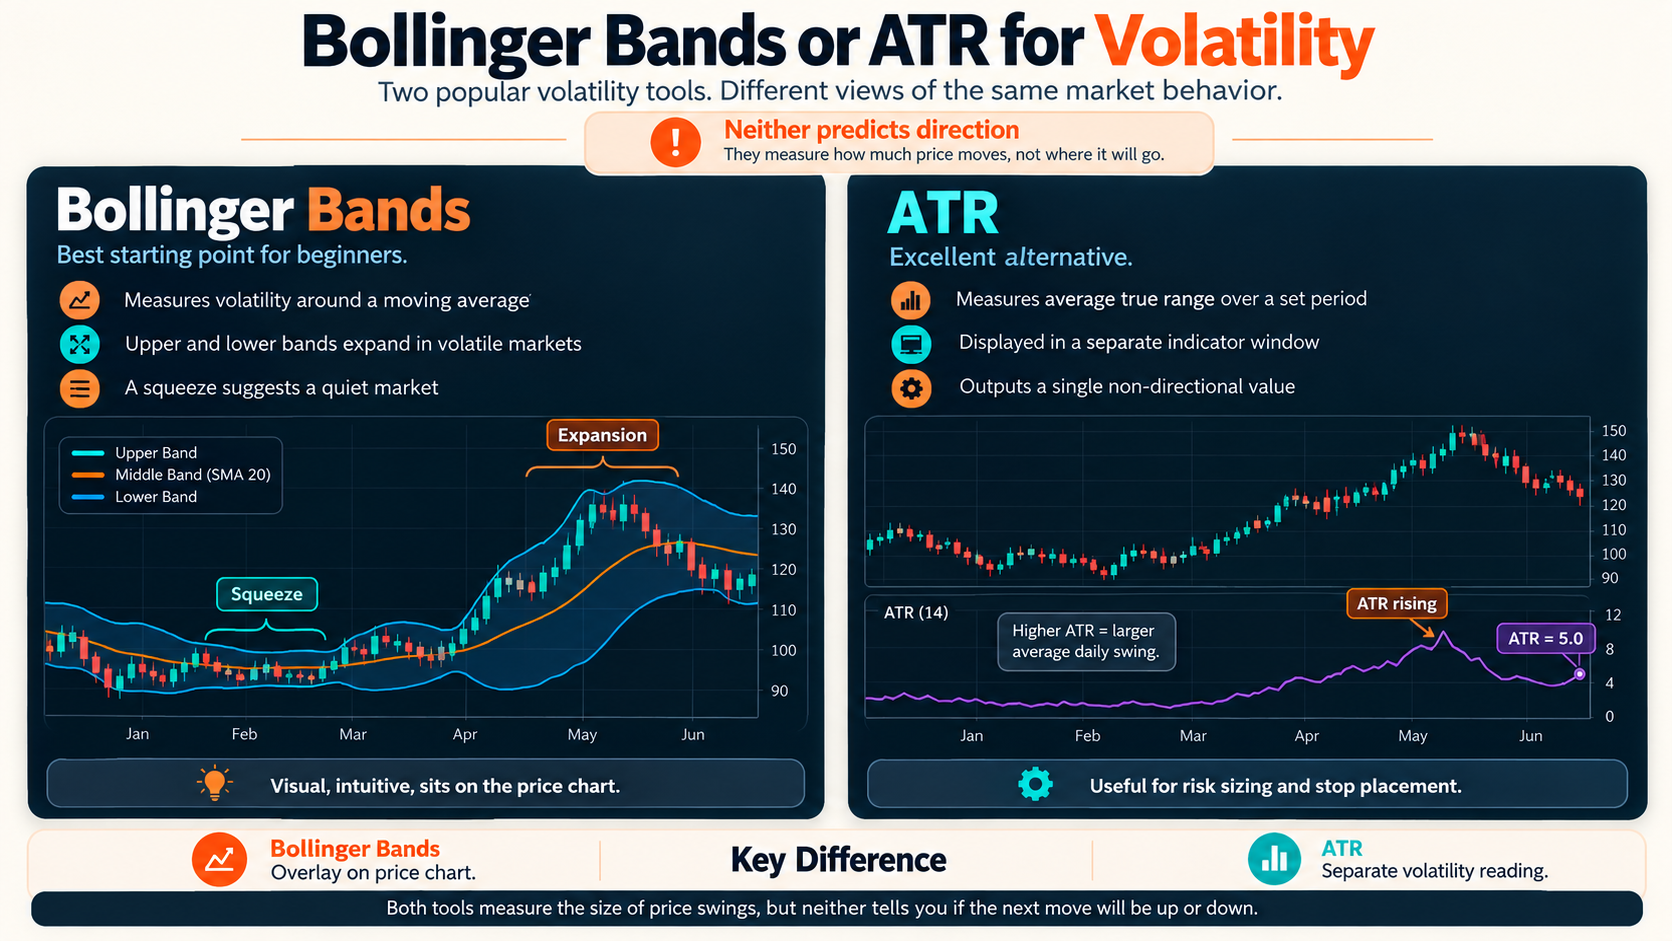
Bollinger Bands are the best starting point for beginners because they plot directly onto your price chart, making them highly visual.
- What they measure: They measure asset volatility relative to a moving average.
- How they work: The indicator consists of three lines. The center line is a simple moving average (usually 20 days). The upper and lower bands expand when the market is volatile and contract (squeeze) when the market is quiet.
- Why they don't predict direction: When the bands expand, it simply tells you that a big move is happening. The price can ride the upper band higher or the lower band lower—the bands themselves don't care which way it goes.
The Alternative: Average True Range (ATR)
ATR is an excellent alternative, but it sits in a separate window below your main chart.
- What it measures: It measures the absolute mathematical volatility over a specific time frame (usually 14 days).
- How it works: ATR calculates the average size of the gap between the highs and lows of each candle. It gives you a single dollar (or pip) value. For example, if Apple has an ATR of $5.00, it means the stock moves an average of $5.00 a day.
- Why it doesn't predict direction: ATR is strictly a non-directional number. An ATR of $5.00 doesn't tell you if the stock will go up $5.00 or down $5.00 tomorrow; it just tells you to expect a $5.00 swing.
Technical Indicators That Often Add Complexity Too Early
When building a trading strategy, it is easy to assume that more advanced tools lead to better results. However, introducing certain advanced technical indicators too early often adds unnecessary complexity without adding real value.
Here are three types of technical indicators that can complicate your learning process:
- Highly Parameterized Indicators: Tools like the Ichimoku Cloud or complex adaptive moving averages require you to configure multiple settings at once. When an indicator has too many moving parts, it becomes difficult to figure out which specific setting is helping or hurting your strategy.
- Proprietary Indicators: Many custom, black-box algorithms promise a secret edge but hide their exact formulas. This opacity makes it nearly impossible for a novice to truly understand why a buy or sell signal was generated, preventing you from learning the underlying market mechanics.
- Duplicated Indicators: Using multiple indicators that measure the exact same thing—such as combining RSI, Stochastics, and CCI on the same chart—creates a false sense of confirmation. Because they share overlapping mathematical inputs, they will simply tell you the same information in different visual formats, crowding your chart.
These tools are not useless, and many experienced traders use them effectively. However, for a beginner, the added complexity, opacity, and overlapping data create noise. Starting with simpler, transparent tools makes it much easier to isolate variables and evaluate your performance objectively.
Comparison Table: What Each Indicator Can and Cannot Tell You
Complementary Indicators vs Repeated Information
Most momentum tools look different on a chart but ask the same question: where is price now compared with where it's been lately? RSI, the stochastic oscillator, Williams %R, and CCI all use the same price bars, just with different math. So when they all turn high together, that's one piece of evidence shown three or four times, not separate confirmation.
Investopedia gives this exact example: stochastics, RSI, and Williams %R all rely on similar inputs and are likely to give similar results. Some tools are even stacked on each other. Stochastic RSI runs the stochastic formula on RSI values, so it's a momentum reading of a momentum reading.
The fix is simple: take one indicator from each group and let the other groups do the checking.
A quick test: if two indicators almost always agree, they're probably measuring the same thing.
A Simple Chart Walkthrough
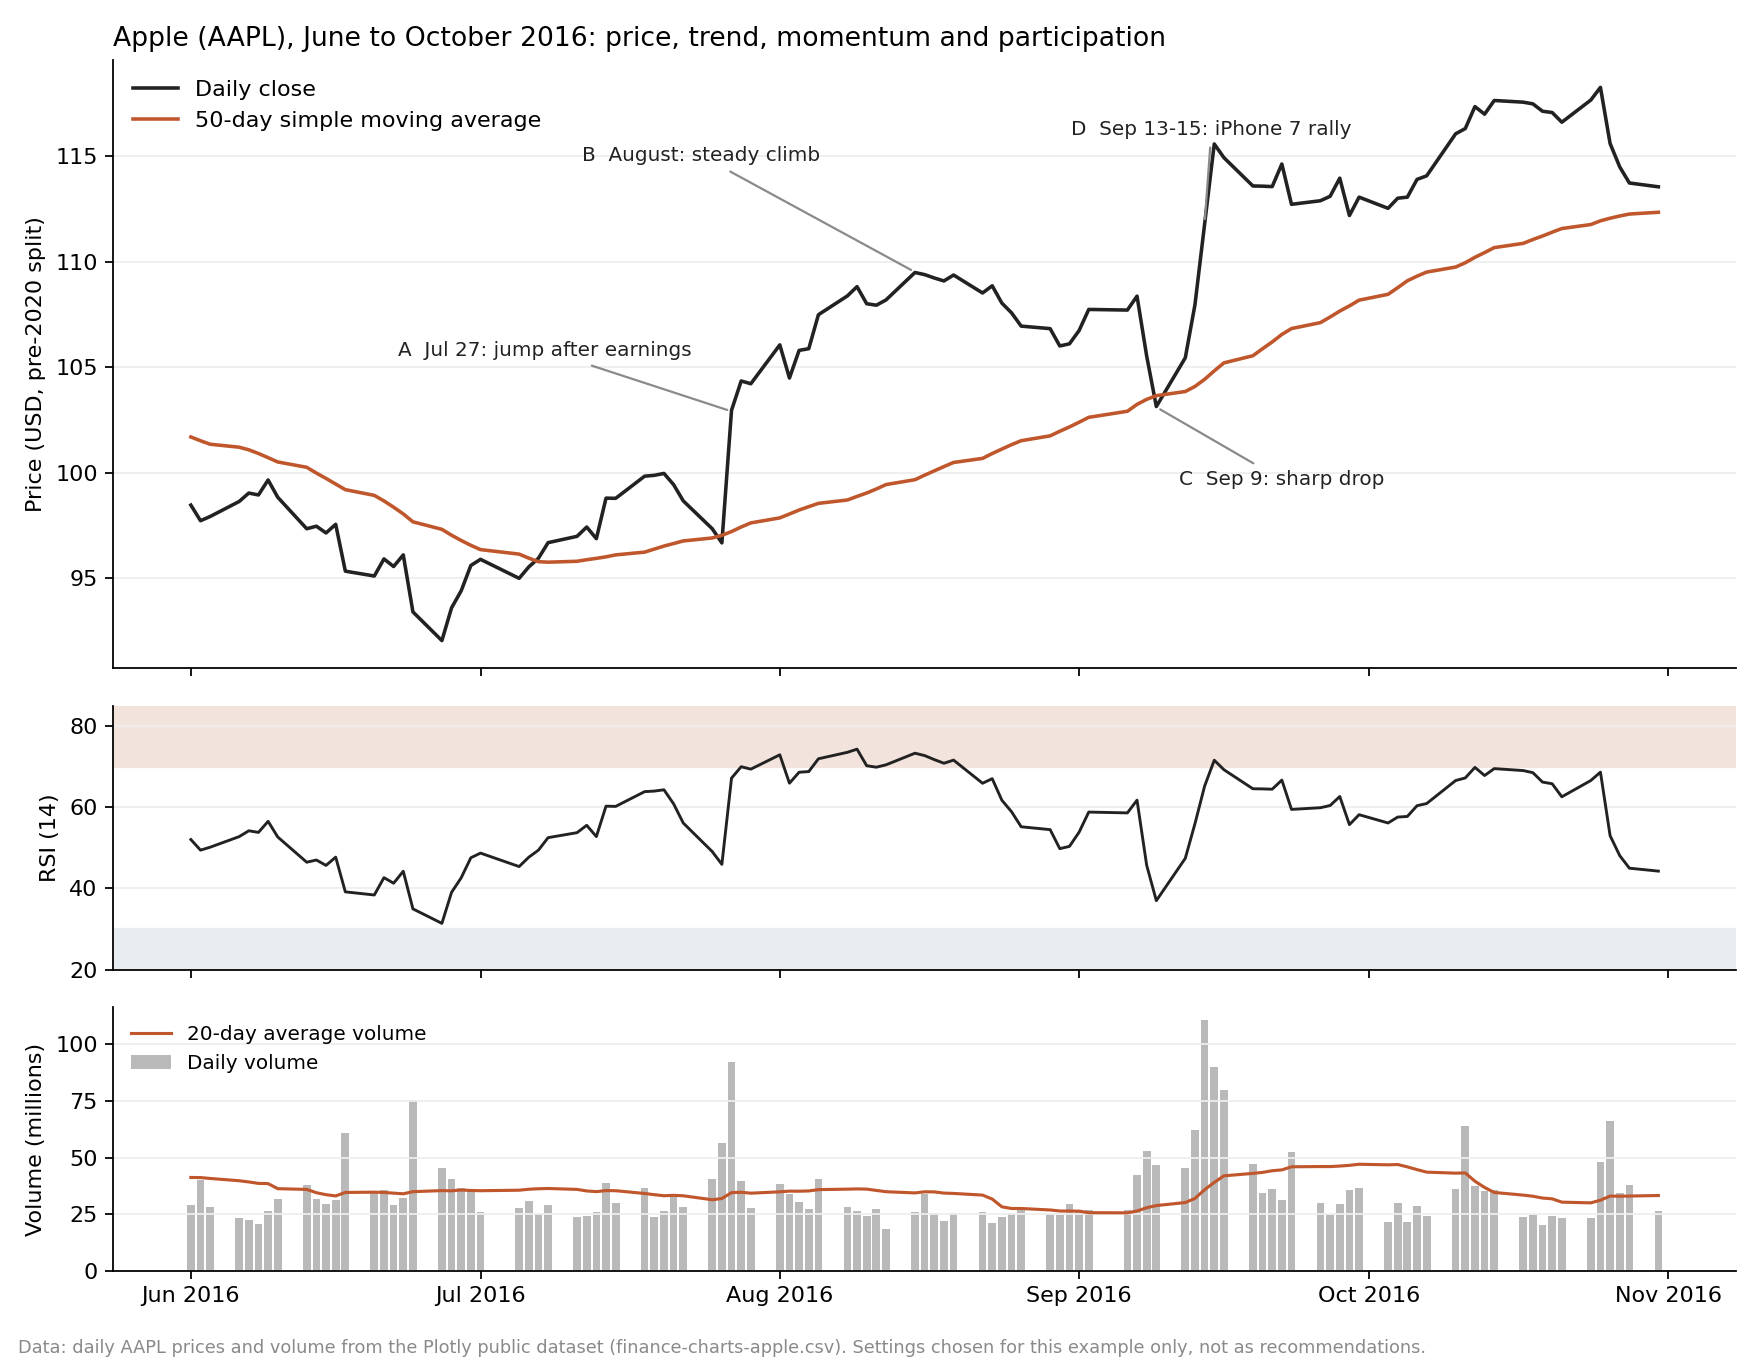
Apple (AAPL), June to October 2016, with three indicators: a 50-day moving average (trend), a 14-period RSI (momentum), and volume (participation). Settings are for this example only.
What each adds: The moving average shows price moving from a downtrend into an uptrend by late July. RSI shows how one-sided the buying got, staying above 70 for most of August while price kept rising. Volume shows which moves had real activity behind them, with big spikes after earnings in late July and during the iPhone 7 rally in mid-September.
Where they disagree: In August, momentum looked strong but volume was below average. On September 9, price dipped under the moving average and RSI dropped, but price was higher a few days later.
What's unknown: Why price moved (the news), whether other settings would change the story, whether one stock in hindsight tells you anything general, and what happened after hours. Prices are also shown as they traded before Apple's 2020 split.
How Market Conditions Change Indicator Behaviour
How market conditions shift indicator behavior:
Trend, Range, and Volatility Comparison
Indicators are mathematical formulas that look backward. They do not predict the future; they only project their own design assumptions onto current price action. When the market regime changes, the indicator's math stays the same. This is exactly why it fails.
Signal Frequency, Delay and the Cost of Acting
Choosing indicator settings is a classic balancing act between speed and accuracy.
- Sensitive settings react quickly to price action and offer early entries, but they also trigger many false signals (whipsaws).
- Smoother settings filter out short-term market noise to focus on the true trend, but their signals lag, which can significantly skew your reward-to-risk ratio.
When you use hyper-sensitive settings, the resulting surge in trade frequency directly exposes you to the cost of acting. Frequent entries cause transaction fees and bid-ask spreads to compound rapidly, quietly draining your capital. Worse, this constant stream of signals often tricks traders into technical overtrading—a behavioral trap where you bleed your account on low-conviction setups and turn what could be a profitable strategy into a net-negative system.
Testing an Indicator Without Fooling Yourself
It's easy to trick yourself into seeing a winning strategy where none exists. To keep your indicator testing honest, always stick to these core rules:
- Write it down: Define your entry and exit rules before looking at charts so you don't rewrite history.
- Get a big sample: Use at least 100+ trades over several years; a handful of lucky wins means nothing.
- Include real costs: Deduct trading fees, commissions, and slippage, or your paper profits will vanish.
- Test "out-of-sample": Build your strategy on one set of data, then test it on entirely unseen data to see if it actually holds up.
- Accept losses: Do not tweak your indicator settings after every losing trade, or you will over-fit the past and fail in live markets.
Mastering these basics prevents you from chasing ghosts. Once your rules are locked in, you are ready to transition to a structured historical environment with our guide to backtesting trading strategies.
Limits in Crypto Markets
Using traditional technical indicators in crypto introduces unique limitations, sort of like how eating at a restaurant rather than a home-cooked meal introduces limitations as well:
- 24/7 TradingTraditional indicators rely on fixed daily "closes" to reset. Because crypto never sleeps, daily candles are arbitrary, often distorting time-bound signals like standard moving averages.
- Venue-Specific VolumeCrypto markets are fragmented. Indicators tracking volume—like the Chaikin Money Flow—only look at individual exchanges rather than the global market, allowing fake data or wash trading on low-quality venues to warp signals.
- Thin Order BooksMany altcoins suffer from deep illiquidity. This makes indicators highly vulnerable to single large trades that spark artificial technical breakouts or breakdowns.
- Rapid Regime ChangesCrypto shifts between extreme high-volatility and dead ranges instantly. Standard indicators struggle to adapt to these lightning-fast environment flips, leaving traders lagging.
- Short Token HistoriesNew assets lack the historical data required for long-term indicators (e.g., a 200-day moving average). Backtesting is virtually impossible, forcing traders to rely on unconfirmed short-term charts.
Conclusion: Fewer Indicators, Clearer Questions
Beginners gain more from understanding a small number of distinct inputs than from a crowded chart. It is also important to recognize the limits of technical analysis. Indicators are not crystal balls; they are mathematical calculations based on past price and volume data. They show you where the market has been, not guarantee where it is going.
Because technical analysis deals with probabilities rather than certainties, you must always define your risk before looking for signals. Knowing your exit point and how much capital you are willing to risk on a trade is far more critical to long-term success than finding the perfect entry setup.
Disclaimer: The content provided in this article is for educational and informational purposes only and should not be considered financial or investment advice. Interacting with blockchain, crypto assets, and Web3 applications involves risks, including the potential loss of funds. Venga encourages readers to conduct thorough research and understand the risks before engaging with any crypto assets or blockchain technologies. For more details, please refer to our terms of service.