
Table of Contents
The market history does not change when a chart is zoomed, but the data grouping, visible period and scale change what the eye can detect. A five-minute chart can look chaotic while a daily chart shows a stable broader trend.
Three Settings People Often Call the Timeframe
When traders use the word "timeframe," they often mix three completely independent structural settings:
- Candle Interval: The specific time period packed into a single bar (e.g., a 5-minute or 1-day candle) which dictates localized detail.
- Total Lookback Window: The amount of historical chart data visible on your screen (e.g., 3 months of past price action) providing macro context.
- Intended Holding Period: The actual execution horizon you plan to remain in the position (e.g., a 10-minute scalp vs. a 2-week swing trade).
Mixing these metrics causes analysis desynchronization, leading to flawed risk management:
- Over-zooming: Acting on a micro candle interval pattern while ignoring a major macro resistance level hidden by a narrow lookback window.
- Stop-Loss Mismatches: Finding a great structural setup on a daily chart but applying a tight risk stop meant for a 15-minute holding period, causing normal market noise to prematurely shake you out of a valid position.
How Candles Compress Price Information
Here's how multiple lower-interval candles become one higher-interval candle using an original diagram.
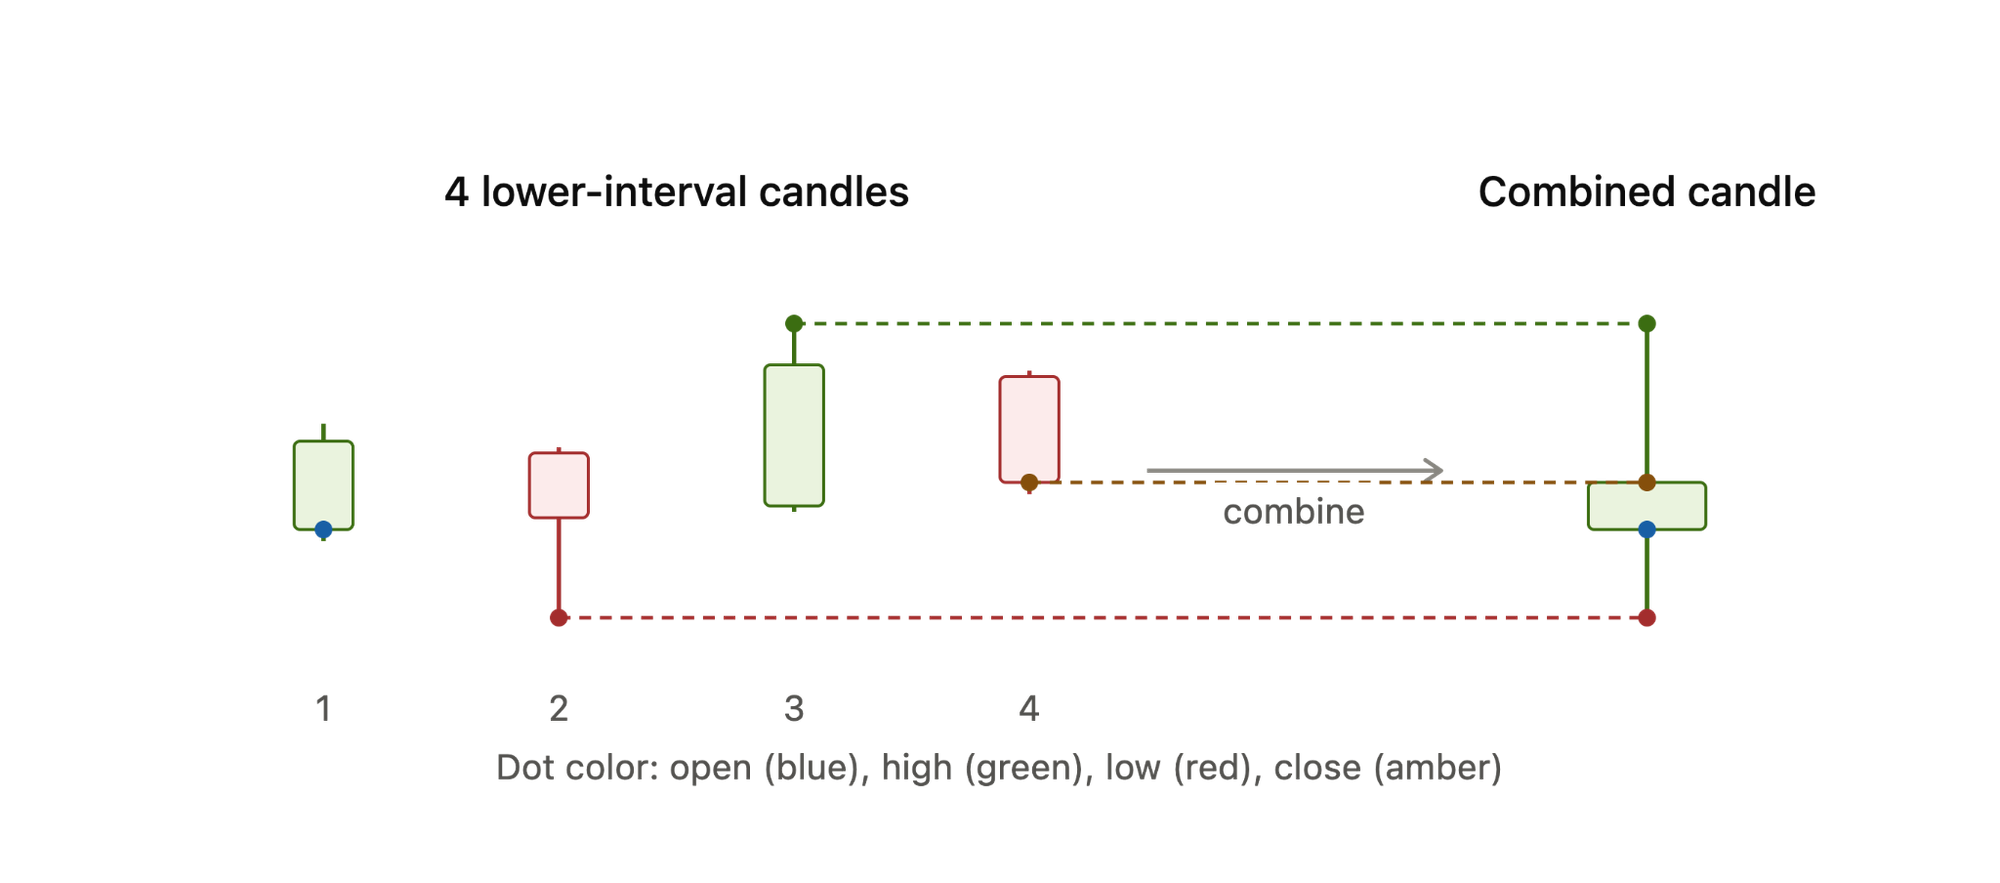
Four candles, four values, but they don't blend evenly. Each one comes from a single, specific candle:
- Open is candle 1's open, nothing else.
- Close is candle 4's close, nothing else.
- High is the highest high across all four, wherever it happened to occur (here, candle 3).
- Low is the lowest low across all four, wherever it occurred (here, candle 2).
How the Measurement Window Changes the Number
Here is the difference between candle range, return over a selected period and rolling volatility using an example.
Say a stock trades: open €100, swings up to €104, down to €98, and closes the hour at €101.
- One-hour candle range: high minus low for that hour. €104 − €98 = €6. This just tells you how much noise happened inside the hour, nothing about direction.
- One-day return: day's open vs day's close. If the day opened at €100 and closed at €101, that's +1%. This ignores everything that happened in between, it only cares about start and end.
- Seven-day rolling volatility: the spread of daily returns over the week, e.g. +1%, −3%, +2%, −1%, +4%, −2%, +1%. Average those and you get a small net return, but the volatility figure (something like the standard deviation) comes out fairly high, because the up and down days cancel each other in the return calculation without cancelling in the volatility one.
So on the same day, in the same stock, you could see a wide hourly range, a small daily return, and high weekly volatility, all at once. That's not a contradiction, it's just three different rulers measuring three different things: noise inside a window, net change across a window, and consistency of movement across many windows.
Why Market Volatility Looks Different at Different Scales
Market Volatility looks different because how we measure and compress price data completely alters our perception of risk.
- Absolute Moves: The literal dollar-and-cents change (e.g., a $5 drop). It ignores the asset's overall price tag, making direct asset comparisons inaccurate.
- Percentage Moves: The price change relative to the starting price (e.g., a 5% drop). This is the gold standard for measuring true economic impact.
- Range: The total distance between the absolute highest and lowest prices (High minus Low) during a specific timeframe.
- Noise: Erratic, short-term price bounces and market volatility that lack a clear direction. Noise dominates micro-charts but blurs into clean trends when you zoom out.
- Smoothness ≠ Safety: A long-term chart might look like a smooth, safe line, but that is just an artifact of compressed data. The visual smoothness does not erase the crushing daily drops and market volatility that occurred along the way.
- Hidden Intraday Chaos: A daily candlestick only shows the Open, High, Low, and Close. It completely hides the path taken. A stock could smoothly drift between its high and low, or it could violently whip back and forth multiple times. Both days produce the exact same daily candle, but one carries hidden intraday risk.
Market Sessions, Weekends and Event Windows
Charts rarely move in a steady, uniform line; instead, they experience highly concentrated bursts of activity. This is driven by three main forces:
Scheduled Announcements: Key macroeconomic data or company earnings releases draw heavy attention. Traders cluster around these specific times, causing sharp, vertical spikes in volume and price.
Liquidity and Spreads: Thicker markets feature deep order books and tighter spreads. When liquidity is high, huge orders flow smoothly without drastically disrupting the price trend.
Participant Mix: Distinct market sessions dictate who is actively at the trading desk. When major regional sessions overlap—such as London and New York—the mixture of institutional size and retail volume hits its daily peak.
Even though cryptocurrency markets operate 24/7/365, comparing a weekend data sample directly to a weekday session is fundamentally flawed.
- The Institutional Absence: Big institutional desks, market makers, and traditional fund managers generally go offline from Friday evening until Monday morning.
- The Retail and Bot Dominance: The weekend participant mix shifts heavily toward retail investors and automated algorithmic bots.
- Thinner Market Depths: Because overall trading volume drops significantly on Saturdays and Sundays, market liquidity dries up.
Consequently, a chart pattern or indicator breakout that requires immense, sustained institutional capital to look valid on a Tuesday might be entirely simulated by a low-volume retail spike or an aggressive whale order on a Sunday. Although most things seem better on the weekends, for example, our lives, crypto trading is not necessarily one of those things that is better to do on the weekend.
The Same Market, Three Different Readings
Picture a hypothetical week where Bitcoin sits around $62,000.
Short interval: hourly, Monday
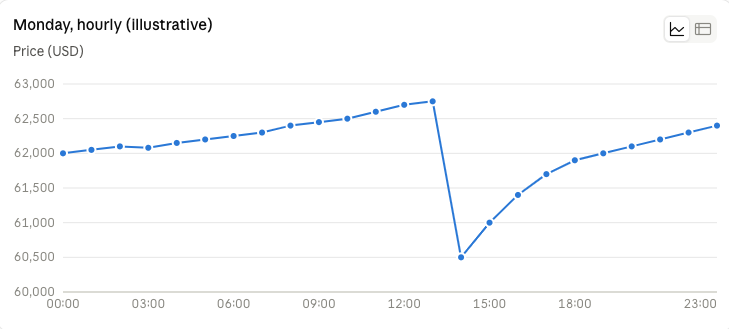
At this zoom, the trend looks choppy, no clear direction. The range feels wide, a roughly 3.5% swing top to bottom. The dominant feature is a sharp drop around 14:00, something like a large sell order hitting thin liquidity, followed by a steady climb back. Someone watching only this window would call it a volatile, event-driven day.
Medium interval: daily, that same week
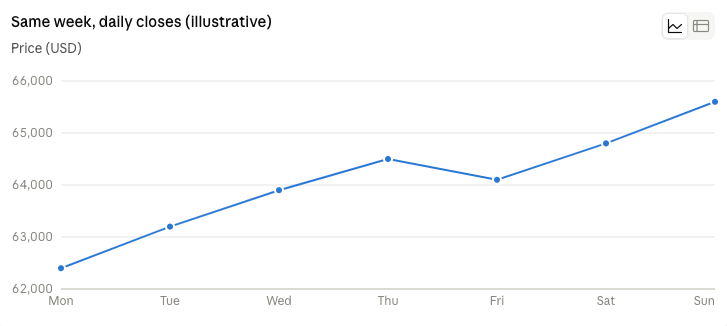
Zoom out to daily candles and Monday's "crisis" basically disappears. It closed higher than it opened, so it just reads as an ordinary up day. The trend here is a clean, steady climb, up about 5% for the week. The range is narrow and unremarkable day to day. There's no key event visible at all, because the thing that felt dramatic intraday was fully absorbed by the close.
Long interval: weekly, that quarter
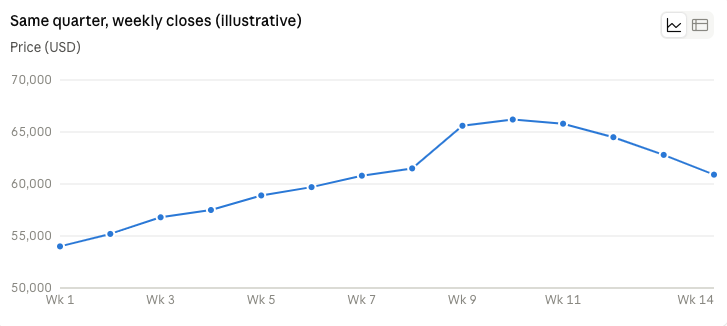
Now our featured week (week 9) is just one stop on a longer climb, and the real story only shows up here: the rally tops out the following week, then rolls into a multi-week decline. Neither the hourly chart nor the daily chart gave any hint that a reversal was coming, because that pattern only exists at this timescale.
None of the three views is wrong. The hourly chart correctly showed real, sharp volatility. The daily chart correctly showed a genuine uptrend. The weekly chart correctly showed that uptrend was actually the top of a larger move.
Shorter Intervals: Detail and Noise
Trading on an ultra-short timeframe means battling market noise where ordinary, random fluctuations can easily look like major trends.
Execution and Spreads
- Spread Friction: Bid-ask spreads eat up a massive percentage of your profit margins on micro-moves.
- Slippage: Fast price action means execution delays turn winning setups into immediate losses.
- Order Limits: Market orders invite heavy slippage, while limit orders risk missing the move entirely.
The Risk of Noise
The biggest trap is overreacting to random fluctuations. Mistaking micro-fluctuations for structural breakouts leads to overtrading and heavy fee accumulation.
Longer Intervals: Context and Compression
Longer time-series intervals act as data compression that highlights broader trends and stable structural cycles by filtering out day-to-day noise. However, this perspective causes a complete loss of intraday paths, micro-fluctuations, and precise entry timing details.
Matching the Chart to the Decision
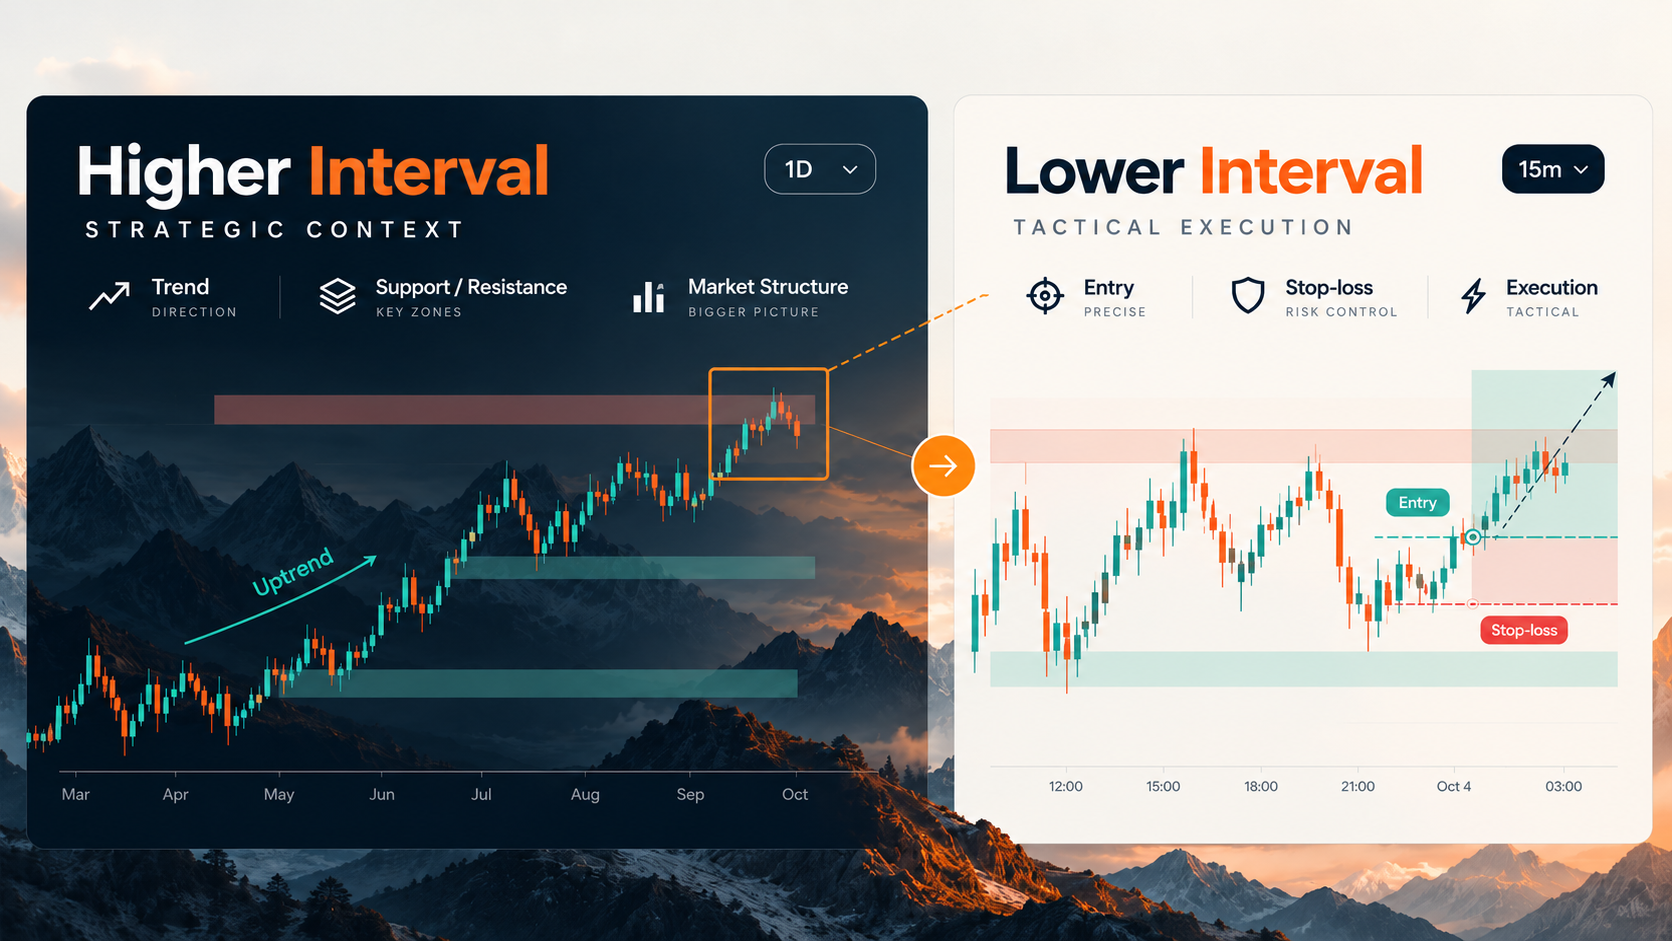
Successful trading requires aligning your data window with your operational reality. There are no fixed timeframe recipes because market dynamics are fractal. Instead, you must map your analysis interval directly to your strategy horizon, your physical monitoring ability, and your final order execution style.
The Higher Interval (Strategic Context): A macro chart filters out short-term market noise and identifies institutional capital flows, major support/resistance zones, and the dominant trend. It tells you what direction to trade.
The Lower Interval (Tactical Execution): A micro chart provides granular visibility into sudden momentum shifts. It allows you to place tight stop-losses, avoid overpaying due to sudden intraday slippage, and pinpoint the exact moment when to execute.
A Repeatable Multi-Timeframe Reading Method
Here is the Multi-Timeframe Framework:
- Broader Interval: Review the macro chart (e.g., Weekly/4-Hour) for major structure and key levels.
- Invalidation: A candle body close beyond a major macro swing high/low, breaking the overall trend bias.
- Holding Horizon: Establish your core operational chart (e.g., Daily/15-Min) to target objectives.
- Invalidation: A structural breakdown or failure of the intermediate support/resistance zone anchoring your trade.
- Decision Interval: Zoom in (e.g., 1-Hour/5-Min) to find entry patterns, volume spikes, or liquidity sweeps.
- Invalidation: A counter-trend candle closure that immediately negates the entry pattern.
- Execution Detail: Drill down to a micro chart (e.g., 5-Min/1-Min) only for precise, high-volatility execution.
- Invalidation: A violation of the micro swing point, order block, or fair value gap protecting your stop-loss.
Scale, Indicators and Other Sources of Distortion
When you look at a trading chart, the data isn't always telling you the objective truth. Your charts are highly prone to hidden distortions based on how you set them up.
Here is how different settings change your interpretation of the exact same market data:
- Linear vs. Logarithmic Scale: A linear scale plots price in absolute dollar amounts, which makes long-term trends look explosively parabolic. A logarithmic scale plots price based on percentage moves. A 100% gain looks identical visually whether a stock goes from $1 to $2 or $10 to $20.
- Incomplete Candles: The newest candle on an active chart changes constantly until the time frame closes. Making decisions based on an unfinished bar can trap you into false breakouts or fake reversals.
- Timezone & Session Cutoffs: The time zone your chart uses determines when a daily candle opens and closes. Shifting from Exchange Time to your local timezone alters the visual high, low, and pattern of a daily candle.
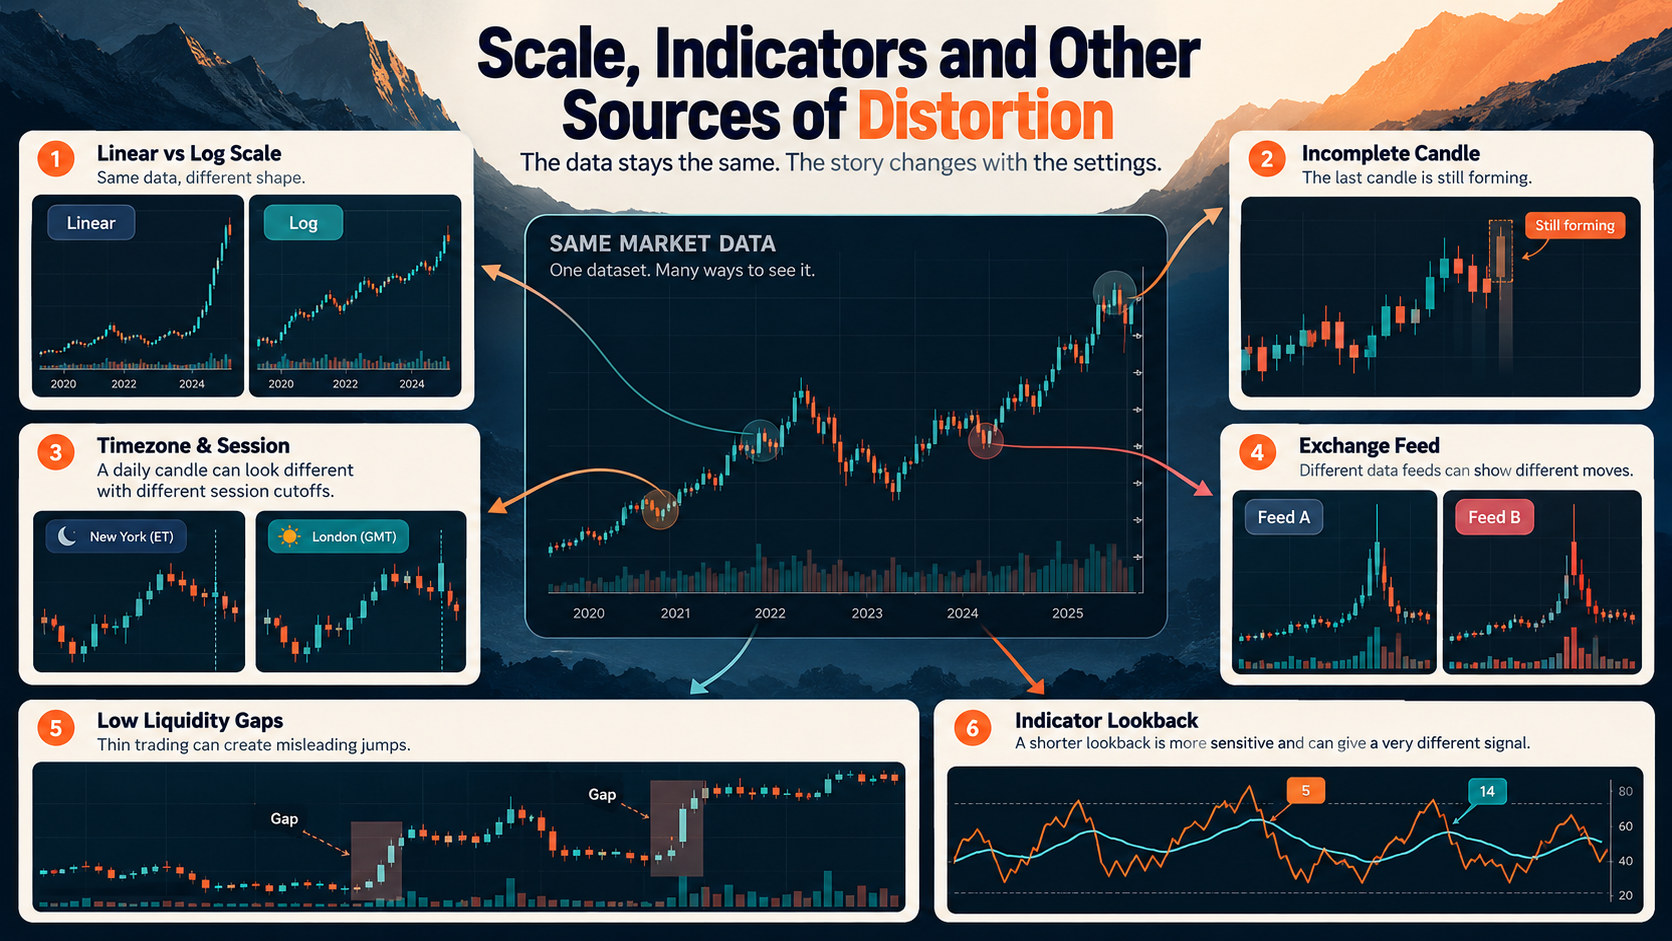
- Exchange Data Variations: Not all feeds are created equal. A decentralized asset like Bitcoin or a stock traded across different pools will display slightly different price spikes and volume profiles depending on which specific exchange feed you load. Choosing a feed is like choosing what you want to eat for dinner. Not all meals are created equal. Some just taste better than others.
- Low Liquidity Gaps: Illiquid assets don't trade continuously. This creates massive visual gaps and abrupt price jumps, making traditional chart patterns and trendlines highly unreliable.
- Indicator Lookback Period: Indicators like the RSI or Moving Averages depend entirely on your lookback setting. Shifting an RSI lookback from a standard 14-period to a 5-period turns a smooth lagging trend-follower into a highly sensitive, erratic trigger.
Ultimately, the data doesn't change, but each individual setting completely changes the story your chart is telling you.
Questions a Chart Cannot Answer on Its Own
While technical analysis using charts can spot market trends, a chart alone cannot provide a complete investment assessment because it completely misses crucial fundamental, macro, and personal factors.
Here are the key questions a chart cannot answer on its own:
- Valuation: Is the asset actually overvalued or undervalued based on its underlying revenue, cash flow, P/E ratio, or network utility?
- Counterparty Risk: Who is holding the other side of the trade or managing the fund, and what is the likelihood that the exchange, broker, or issuer defaults?
- Token Supply Changes: Are there upcoming token unlocks, scheduled inflation, or founder vesting periods that could suddenly dilute the asset's value?
- Regulation: Is a regulatory body about to ban, restrict, or classify the asset in a way that destroys its liquidity or legal status?
- News & Macro Events: What unexpected real-world events—like interest rate hikes, geopolitical conflicts, or sudden CEO departures—will instantly break the historical chart pattern?
- The Trader's Financial Capacity: Can the specific trader actually afford the risk, manage the emotional stress, or survive the margin requirements if the trade doesn't work out as planned?
Conclusion: Zoom Changes the Question
Chart settings frame the same market data for different decisions. A one-hour chart answers "what's happening right now." A weekly chart answers "where is this actually headed." Same data, different lens, different decision each is useful for. Here's a simple habit worth following: whenever you describe volatility, jot down the interval, the lookback period, the data source and why you're looking. It only takes ten seconds.
Disclaimer: The content provided in this article is for educational and informational purposes only and should not be considered financial or investment advice. Interacting with blockchain, crypto assets, and Web3 applications involves risks, including the potential loss of funds. Venga encourages readers to conduct thorough research and understand the risks before engaging with any crypto assets or blockchain technologies. For more details, please refer to our terms of service.